In this gold price forecast next week, we examine the critical July 26 – August 01 window, with XAU/USD currently trading at $4,055.52 as of Friday morning (July 25). Gold closed last week at $4,013.47 after a volatile stretch, and the early Friday bounce has lifted it just below the key 50-period moving average. Last week’s attempt to clear $4,070 failed as sellers regained control, leaving the metal vulnerable to a retest of the $4,000 floor.
The technical picture remains bearish, with price trading below the 20, 50, and 200-period MAs on the four‑hour chart. A test of the psychologically vital $4,000 floor looks inevitable unless the Fed surprises with an explicitly dovish signal. Read on for the levels, scenarios, and risk factors that traders need to manage this week.
Last Week in Review
Price Action Recap
Gold opened Monday near $4,030 and quickly rallied to a weekly high of $4,070 after headlines suggested a possible de‑escalation of trade tensions. The breakout attempt was short‑lived; sellers emerged exactly at the descending triangle resistance that had capped price since early July. By Wednesday, XAU/USD had retreated to $4,040, and the bearish momentum accelerated on Thursday after US durable goods orders printed above consensus.
Friday’s session saw the metal touch a low of $4,007 before a minor bout of safe‑haven buying lifted the close to $4,013.47. The weekly range of $63 illustrates elevated two‑way volatility, yet the net result was a bearish engulfing candle that swallowed the previous week’s entire body. Volume on the sell‑off was above the 20‑week average, reinforcing the conviction behind the move.
The $4,000 handle held on a closing basis, but only barely. Each dip below $4,010 was met with immediate buying, suggesting large bids are parked around the level. However, the failure to close above the $4,056–$4,070 zone left the short‑term structure firmly negative.
Key Events That Moved Gold
Last week’s US durable goods report surprised to the upside, with core orders climbing 0.8% versus the 0.3% forecast. The data pushed real yields higher and erased any remaining hope of a near‑term Fed pause, sending gold sharply lower in the hours after the release. A subsequent Reuters poll showed economists now assign only a 15% probability to a rate cut in 2026.
Geopolitical concerns provided only fleeting support. Brief escalations in the South China Sea and a cyber‑attack on a major European bank briefly boosted bids, but the moves were faded within hours. The overriding theme remained resilience in the US economy, which kept the dollar index firm above 104 and weighed heavily on the non‑yielding metal.
Weekly Close Analysis
The weekly settlement at $4,013.47 sits below all three key moving averages — the MA20 ($4,025.26), MA50 ($4,057.47), and MA200 ($4,159.27). This triple‑alignment of price below the moving average ribbon is a classic bearish continuation signal. The close also pierced the previous week’s low, turning the $4,070 area into a validated lower high.
From a candle perspective, the engulfing pattern suggests sellers are in control heading into the new week. The only bright spot for bulls is the long lower shadow on the daily chart from Friday, which implies some buying interest near $4,000. Still, until the metal reclaims $4,057 on a closing basis, the path of least resistance remains lower.
Next Week Economic Calendar & Gold Impact
The calendar is front‑loaded with high‑impact US events that will test gold’s sensitivity to interest‑rate expectations. The Fed’s policy announcement on Wednesday, coupled with the first estimate of Q2 GDP, will dominate price action. A hawkish hold or a strong growth print could send XAU/USD tumbling through $4,000, while any sign of economic softening would trigger a relief rally.
| Day | Event | Forecast | Previous | Gold Impact |
|---|---|---|---|---|
| Mon 27 | No high‑impact US data | — | — | Range‑bound, technical trade |
| Tue 28 | CB Consumer Confidence | 102.5 | 101.4 | Beat = bearish for gold (USD up) |
| Wed 29 | FOMC Rate Decision & Statement | Hold 5.50% | 5.50% | Hawkish hold = strong bearish; dovish tilt = bullish spike |
| Wed 29 | Advance GDP q/q (Q2) | 2.1% | 1.4% | Above 2% = bearish; below 1.5% = bullish |
| Thu 30 | Unemployment Claims | 235K | 228K | Miss (>240K) = supportive for gold |
| Fri 31 | Core PCE Price Index m/m | 0.2% | 0.1% | Hot print (>0.3%) = bearish; soft = bullish |
Technical Analysis
Moving Average Structure
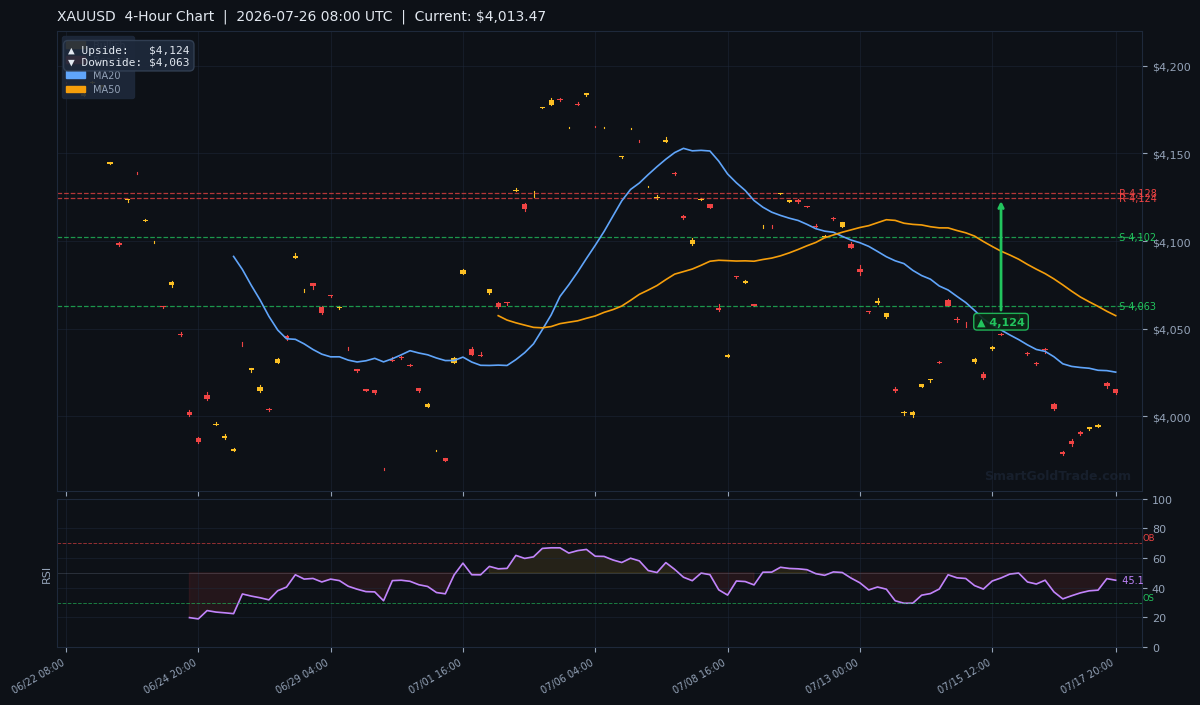
The H4 chart paints an unequivocally bearish picture. Price trades below the 20‑period MA ($4,025.26), the 50‑period MA ($4,057.47), and the 200‑period MA ($4,159.27). The shorter‑term MA20 is below the MA50, forming a classic death‑cross alignment that invites sell‑on‑rallies behavior. Every attempt to push above $4,025 last week was rejected, reinforcing this level as the immediate trend‑defining resistance.
The 200‑MA near $4,159 acts as the longer‑term bull/bear dividing line. As long as price remains trapped below it, the broader structural damage from the June sell‑off stays intact. A weekly close above $4,159 would be required to flip the narrative, but that appears unlikely without a major catalyst.
RSI and Momentum
The 14‑period RSI stands at 45.1, residing squarely in the neutral zone but below the 50 centerline. This configuration denotes weak momentum and a lack of oversold conditions, meaning another leg lower does not require a prolonged consolidation. For bulls to gain confidence, RSI must push above 50, which would coincide with a price reclaim of the $4,025 MA20.
True volatility, as measured by the ATR(14) of $12.14, remains subdued. The average daily range over the past two weeks has been approximately $24, slightly above the H4 ATR projection. Even with the Fed meeting on the calendar, the ATR suggests a manageable expansion to roughly $30–$35 on event day rather than chaotic swings.
Key Support and Resistance Levels
Calculated pivot points from the chart analysis show the following critical zones:
- Resistance R1: $4,164.23
- Resistance R2: $4,159.15
- Support S1: $4,147.61
- Support S2: $4,124.26
Note that the S1 and S2 levels currently sit above price; they function as resistance until reclaimed. Combined with the moving averages, this creates a dense supply zone from $4,124 up to $4,164. The technical price targets derived from pivot analysis are:
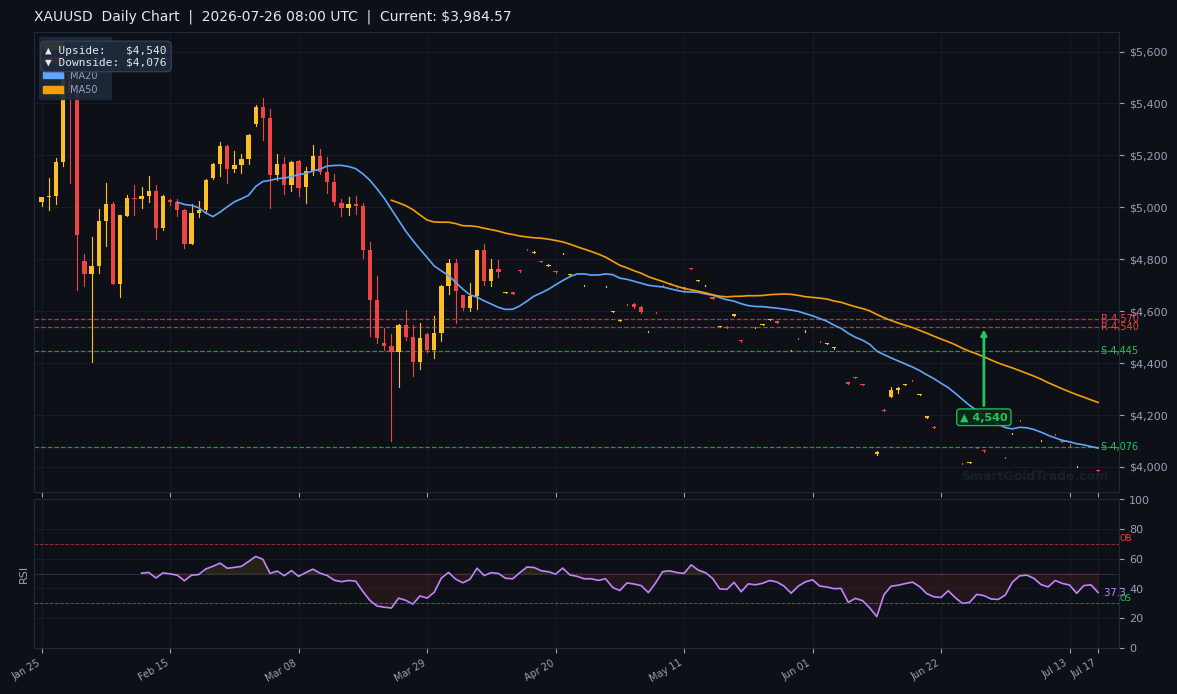
- Daily upside target: $4,540
- Daily downside target: $4,076
- 4‑hour upside target: $4,124
- 4‑hour downside target: $4,063
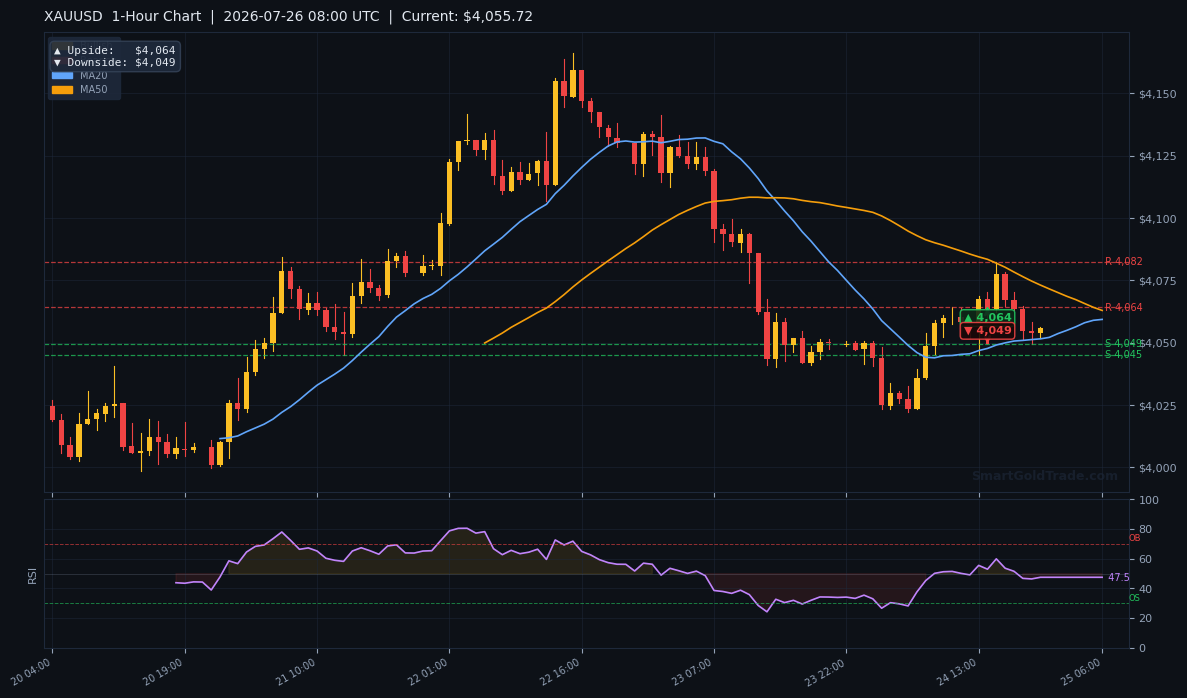
- 1‑hour upside target: $4,064
- 1‑hour downside target: $4,049
These levels frame the probable weekly range. A break below $4,049 opens a path toward the daily target of $4,076 and potentially the $4,000 psychological barrier. On the upside, a move above $4,064–$4,124 would be needed to challenge the bearish grip.
Trading Scenarios This Week
For traders looking to act on this gold price forecast next week, using a Shariah-compliant trading platform ensures you can trade spot gold without riba or leverage — aligning your strategy with Islamic finance principles.
Bullish Scenario (probability 30%)
Any bullish outcome requires a dovish surprise from the Fed or a sharp miss on GDP. If the statement removes the ‘patient’ language or if GDP prints below 1.5%, gold could rally swiftly. The trigger for a swing long is a 1‑hour close above the $4,064 resistance (the 1‑hour upside target).
In that case, the entry zone sits between $4,055 and $4,065, with a first target at the $4,124 4‑hour level. Aggressive bulls can aim for $4,147 (S1 resistance). The stop‑loss should be placed below $4,025 to avoid being shaken out by a false breakout.
Bearish Scenario (probability 60%)
A hawkish Fed hold that reiterates the higher‑for‑longer narrative is the most likely outcome. Combined with a GDP figure above 2.0%, this would accelerate the sell‑off. The trigger is a decisive break below the 1‑hour downside target of $4,049 on a closing basis.
Entry can be taken on a retest of $4,049–$4,055 as resistance, targeting the 4‑hour support at $4,063 initially, then the daily downside target of $4,076. A subsequent flush through $4,000 would open the door to $3,980. Stops above $4,064 protect against a quick reversal.
Neutral / Range‑Bound Scenario (probability 10%)
If the economic data comes in precisely as expected and the Fed delivers a perfectly neutral statement, gold may chop between $4,000 and $4,064. The ATR suggests a $24 average daily range, so mean‑reversion traders can fade extremes. Selling near $4,060 and buying near $4,005 with tight stops offers a high‑probability scalping approach. Breakouts beyond either boundary invalidate the range and demand a shift to the directional scenarios.
Risk Factors to Watch
A sudden geopolitical shock—particularly an escalation in Eastern Europe or a major cyber‑attack on financial infrastructure—could trigger a violent safe‑haven bid, negating the bearish technicals. Invalidation of the bearish bias occurs on a 4‑hour close above $4,124, which would flip the short‑term trend. Keep stops tight and avoid holding large positions through the Fed announcement.
For additional confirmation during high-impact events, some traders rely on professional gold trading signals to time their entries and exits with precision.
This gold price forecast next week hinges on the Fed's tone and GDP data. A hawkish hold likely drags XAU/USD below $4,000, while a dovish tilt could spark a relief rally toward $4,124. Manage risk carefully and stay nimble.
FAQ
How accurate is a weekly gold price forecast?
Weekly forecasts provide a framework based on technicals and economic events, but unexpected news can alter the outlook. Always use proper risk management.
What is the most important event for gold this week?
The FOMC rate decision on Wednesday is the primary driver, with the advance GDP release adding to volatility. Both could shape rate expectations.
Can I invest in gold based on this forecast in a halal way?
Absolutely. You can purchase certified gold coins and bars from SmartGoldTrade for physical ownership, or trade spot gold on our Shariah-compliant platform without interest. Both methods are fully halal.