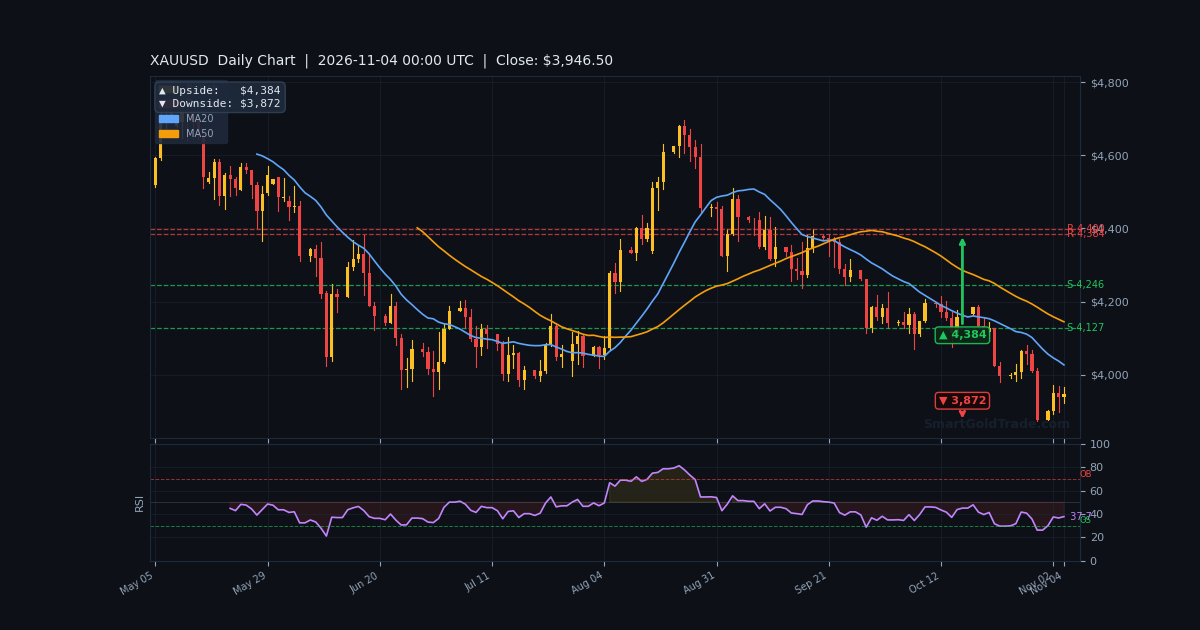
The gold price is holding at $3,946.97 in the Asian session, caught between a firmer US dollar and a market that has already priced in a hawkish Fed. After Tuesday's slide toward $3,900, buyers stepped back in during early Asia, lifting the metal off the session low of $3,924.18. That bounce is encouraging, but it is not yet a trend change. The broader structure remains bearish, with price still below the 200-period EMA on the H1 chart. Last week's solid US job postings data and the ongoing unwind of the October rally continue to weigh on sentiment. Traders should treat this session as a preparation window, not a chase. With liquidity thin and ADX at just 19.2, the market is ranging. The next real catalyst sits 59 hours away with the US Non-Farm Employment Change. Until then, patience pays.
Gold Market Overview
Macro Context
The macro backdrop is a tug-of-war. On one side, real yields are falling: the 10-year TIPS yield sits at 2.62%, down 0.04 week-over-week, and the 10-year nominal yield has slipped to 4.91%. Falling real yields are historically a tailwind for the gold price. On the other side, the broad dollar index has climbed to 121.7, up 0.3 on the week, and that is a clear headwind. SPDR GLD holdings dropped 1.1 tonnes to 1,040.5 t, signaling fund outflows. COT data shows speculators still net long at +186,451 contracts, a positioning risk if the crowd is forced to unwind. News sentiment is mixed at +0.04. Geopolitical risk in the Middle East keeps oil elevated, which supports the dollar's haven appeal and indirectly pressures gold.
Session Outlook
Asian session liquidity is thin. Volume on the current H1 bar is 45,859 versus a 20-bar average of 29,978, so there is participation, but it is concentrated. Expect a likely range between $3,925 and $3,970 unless a headline breaks the calm. The ATR of $16.74 (0.42% of price) defines the expected hourly range. Do not chase moves in this environment. Wait for tests of the levels outlined below.
Technical Analysis
Moving Average Structure
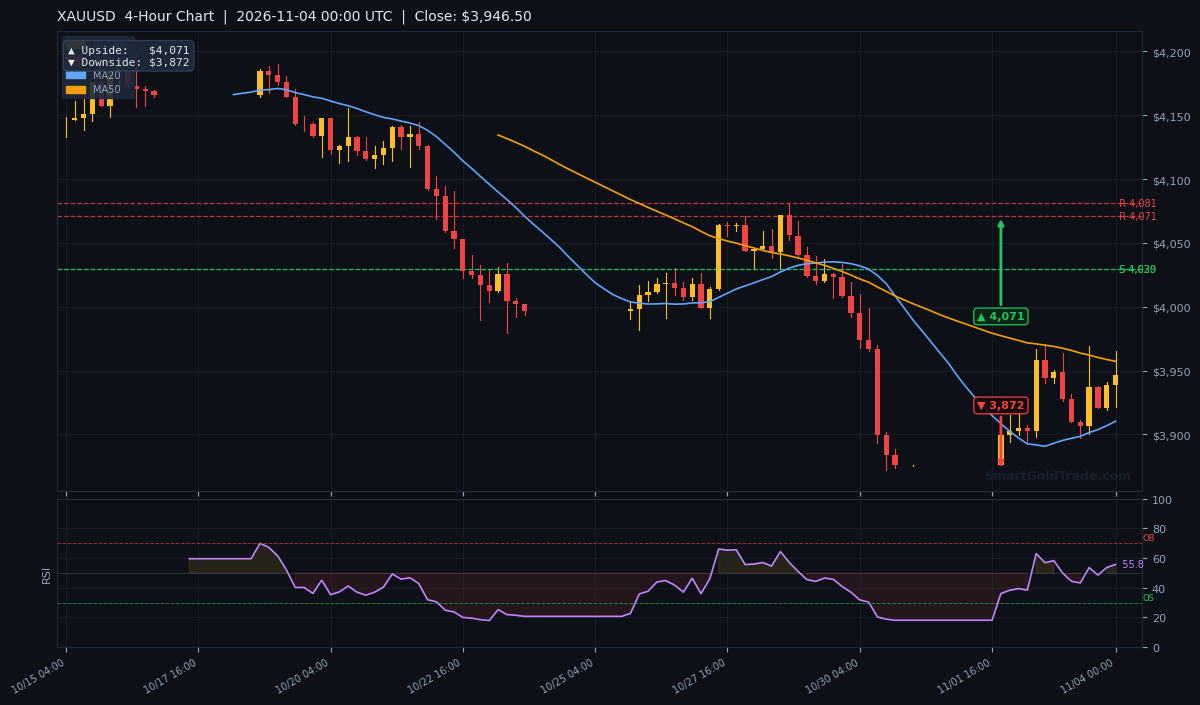
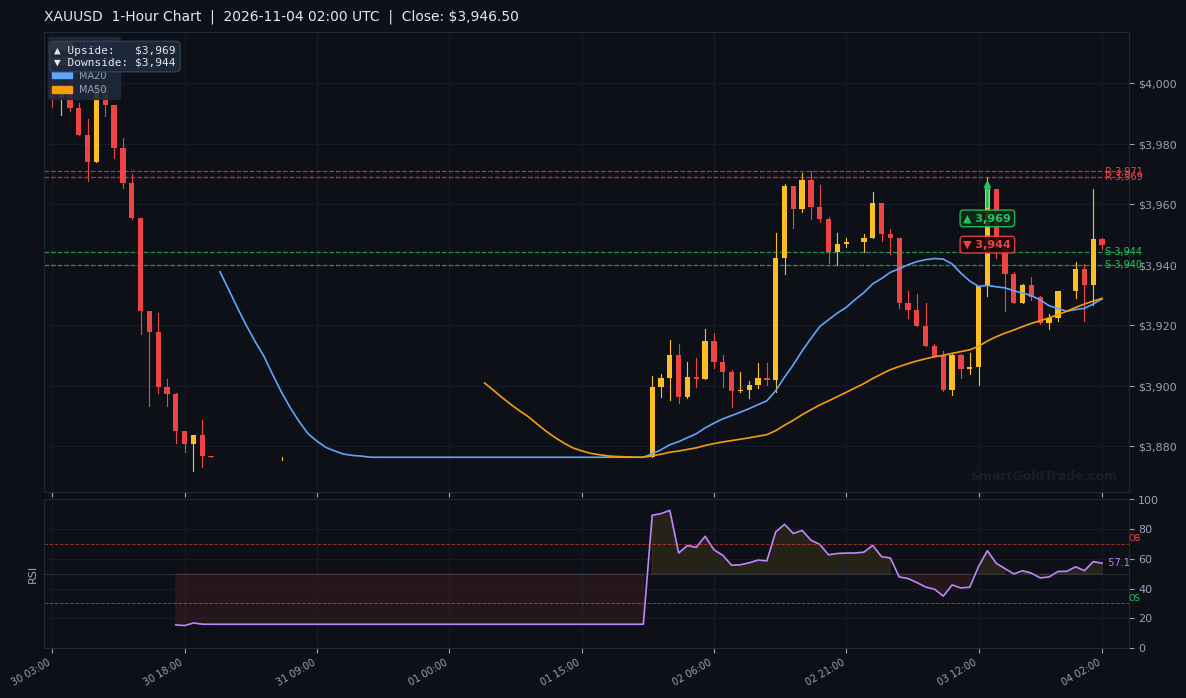
The H1 EMA20 sits at $3,931.01 and the EMA50 at $3,936.16, both below the current price, which explains the bounce. But the EMA200 at $3,996.03 is well above price, confirming the bearish structure. On the H4, the EMA50 is at $3,991.82 and the EMA200 at $4,122.32. On the D1, the EMA50 is at $4,156.17 and the EMA200 at $4,262.53. Every higher timeframe remains bearish. The EMA20 is below the EMA50, a short-term bearish cross that has not yet been invalidated.
RSI and Momentum
The H1 RSI(14) is 56.9, squarely neutral. It is not overbought, so there is room to run, but it is not oversold either, so there is no compelling mean-reversion trade. Stochastic reads 56.0/50.3, also neutral. MACD is at 1.57 with a signal of -0.21 and a histogram of +1.78, a short-term bullish impulse that conflicts with the larger trend. ADX at 19.2 confirms a weak, ranging market. Momentum alone is not a reason to buy.
Key Price Levels
Support: S1 at $3,895.51, S2 at $3,891.24. Resistance: R1 at $3,970.32, R2 at $3,971.16. The Fibonacci 38.2% level at $3,942.26 is the nearest pivot, just 0.28 ATR below price. VWAP at $3,938.03 is also just below. The daily open at $3,931.22 and weekly open at $3,880.80 frame the broader context. PDH is $3,971.16, PDL is $3,895.51.
| Timeframe | EMA50 | RSI | Bias |
|---|---|---|---|
| H1 | $3,936.16 | 56.9 | Neutral-bearish |
| H4 | $3,991.82 | 47.5 | Bearish |
| D1 | $4,156.17 | 37.7 | Bearish |
Fundamental Drivers
The dominant story is the US dollar's resilience. The broad dollar index at 121.7 continues to cap upside for the gold price. Last week's solid rise in US job postings, reported by Kitco, reinforced the view that the labor market remains tight, keeping Fed hawkish bets alive. That said, Commerzbank argues the October correction was overdone, and Bawden Capital calls the selloff the buying opportunity of the decade. Central bank buying jumped 42% in Q3, per the WGC, providing a structural floor. India's demand is seen at a six-year low, removing a physical support pillar. These forces offset each other, which is why sentiment reads neutral.
Key Event to Watch
The single most important event is Friday's US employment report. Average Hourly Earnings are forecast at 0.3% m/m versus 0.1% prior, Non-Farm Employment Change at 65K versus 29K prior, and the Unemployment Rate steady at 4.2%. A strong print would reinforce dollar strength and pressure gold toward $3,895. A weak print would revive rate-cut hopes and open a path toward $3,970.
Unified Technical & Fundamental Outlook
The technical pillar is bearish, scoring -0.75, with price below the EMA200 and a bearish EMA20/EMA50 cross. The fundamental pillar is neutral at -0.04: falling real yields support gold, but a rising dollar and GLD outflows offset that. The combined score is -0.40, bearish, with mixed alignment. The strongest confluence is the bearish technical structure and the rising dollar. The clearest disagreement is between falling real yields, which are bullish, and fund outflows, which are bearish. Neither side has a decisive edge, which argues for range trading rather than directional conviction.
Devil's Advocate
What could invalidate the bearish bias? A daily close above $3,971.16, the R2 and prior day high, would break the immediate structure and put the EMA200 at $3,996.03 in play. A break above that would flip the H1 trend. On the downside, a break below $3,895.51 would target $3,891.24 and open the door to the weekly low at $3,870.20. The scenario that flips the trade is a surprise dovish Fed comment or a weak NFP print. Until either occurs, the path of least resistance is sideways-to-lower.
Trading Strategy for Asian Session
Do not chase. The market is ranging with ADX at 19.2, and thin liquidity punishes impatience. For a short setup, look for a rejection near $3,970.32 (R1), with a stop above $3,987 (one ATR above) and a target at $3,925.40, the Bollinger lower band. For a long setup, wait for a retest of $3,925.40 or the S1 at $3,895.51, with a stop at $3,878 and a target at $3,946.97. Risk-reward on both setups is roughly 1:1.5. If you prefer a passive approach, copy trading lets you mirror experienced gold traders while you study these levels. For those who want to own metal outright, you can purchase physical gold as a longer-term hedge. Position size should be half of normal given the thin session.
Key Takeaways
- The gold price sits at $3,946.97, below the H1 EMA200 at $3,996.03 — bearish structure intact.
- RSI at 56.9 and ADX at 19.2 confirm a neutral, ranging market with no momentum edge.
- Key resistance is $3,970.32 (R1); key support is $3,895.51 (S1).
- The dollar index at 121.7 and GLD outflows of 1.1 t are the main headwinds.
- Friday's NFP (forecast 65K) is the next major catalyst, 59 hours away.
- Combined bias is bearish at -0.40, but alignment is mixed — trade the range, not the trend.
Conclusion
The gold price is in a holding pattern at $3,946.97. The bearish EMA structure and a rising dollar keep the bias tilted lower, but neutral momentum and thin liquidity argue against aggressive positioning. The line in the sand is $3,925.40 on the downside and $3,970.32 on the upside. A break of either level with volume would set the tone for the London session. Until then, the smart play is to wait, define risk, and let the market come to you. Friday's employment report is the real arbiter. Prepare for it now, and do not let a quiet Asian session tempt you into a low-quality trade.
Frequently Asked Questions
- What is the gold price right now?
- The gold price is $3,946.97 per ounce in the Asian session, up 0.39% on the day.
- What are the key support levels for gold today?
- The nearest support is the Fibonacci 38.2% at $3,942.26, followed by S1 at $3,895.51 and S2 at $3,891.24.
- What resistance should I watch?
- R1 at $3,970.32 and R2 at $3,971.16 are the immediate caps. A close above R2 would target the EMA200 at $3,996.03.
- Is now a good time to buy gold?
- With the combined bias bearish at -0.40 and ADX at 19.2, this is a range-trading environment. Wait for a test of $3,925.40 or a confirmed break above $3,971.16 before committing.
- What event will move gold this week?
- Friday's US Non-Farm Employment Change, forecast at 65K versus 29K prior, is the main catalyst. A strong print pressures gold toward $3,895; a weak print opens $3,970.
Trading Gold (XAU/USD) carries significant risk of loss and is not suitable for all investors. This content is for informational purposes only and does not constitute financial advice. Always conduct your own research and trade responsibly.