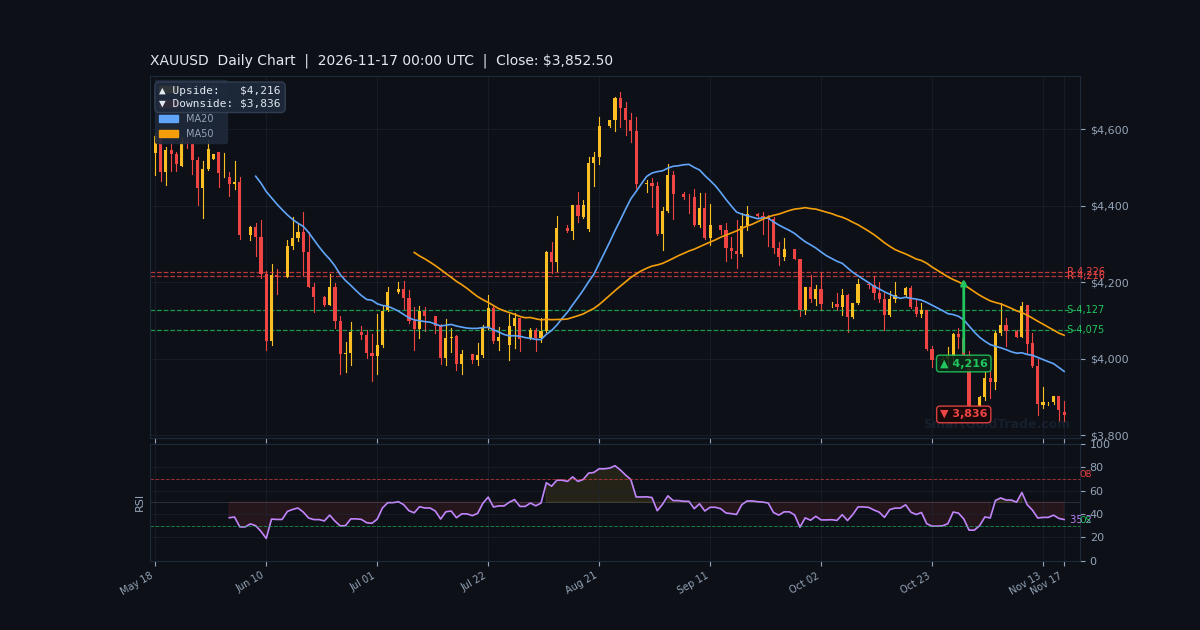
The gold price is holding $3,861.34 in the American session, but the recovery is fragile. Monday's slide to the lowest close since September 2025 has left bulls defending a thin cushion above $3,852.51, the 1-hour pivot that now defines the near-term battleground. Tuesday's modest bounce faded near the intraday high of $3,869.29 as traders positioned ahead of Wednesday's FOMC October meeting minutes.
The macro backdrop remains hostile. The broad dollar index sits at 122.7, a 19-month high, while the 10-year nominal yield holds at 5.15%. Markets have fully priced a December Fed hike and see a nearly 70% chance of another in January, according to the CME FedWatch Tool. That pricing keeps real yields elevated and caps gold's rebound attempts.
For the rest of this session, watch whether $3,852.51 holds on a closing basis. A decisive break would shift focus to $3,841.15, while a reclaim of $3,866.31 would signal short-term exhaustion among sellers.
Gold Market Overview
Macro Context
The dollar's five-day rally has been the dominant driver. The broad dollar index at 122.7 reflects both hawkish Fed rhetoric and safe-haven demand tied to Iran-related tanker attacks in the Strait of Hormuz. Fed's Musalem said the US likely needs several rate hikes by spring to control inflation, reinforcing the higher-for-longer narrative.
Real yields tell the same story. The 10-year TIPS yield at 2.91% is up 0.31% week-over-week, raising the opportunity cost of holding non-yielding bullion. SPDR GLD holdings ticked up 1.7 tonnes to 1,046.1 tonnes, a modest inflow that suggests some long-term buyers are accumulating on weakness. COT data shows speculators still net long 179,548 contracts, leaving room for further long liquidation if support cracks.
Session Outlook
The American session brings Core Retail Sales and Retail Sales prints, both high-impact USD events inside the current hour. Liquidity should improve after the London close, but the data risk argues for patience. The ATR of $14.62 suggests a realistic hourly range of roughly $3,848.61 to $3,878.51 unless a data surprise triggers expansion.
Nvidia earnings after the US close add a second catalyst. Weak tech results could accelerate risk-off flows into the dollar, a negative for gold, while a strong print could ease liquidation pressure across risk assets.
Technical Analysis
Moving Average Structure
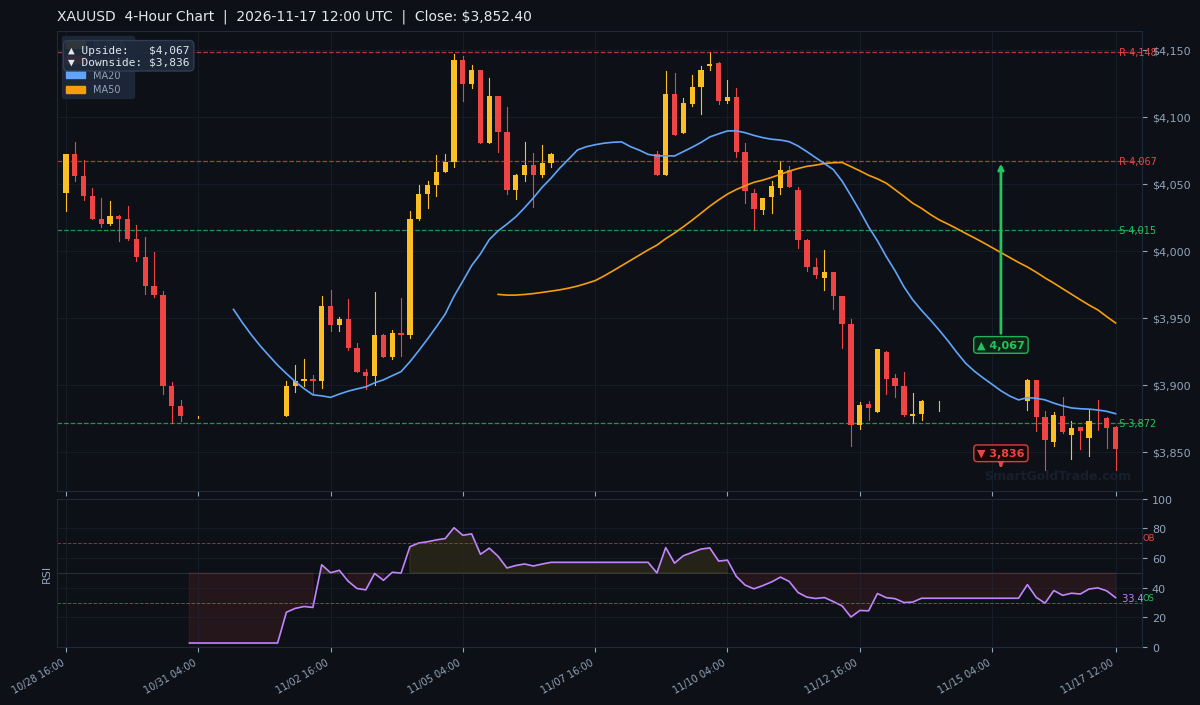
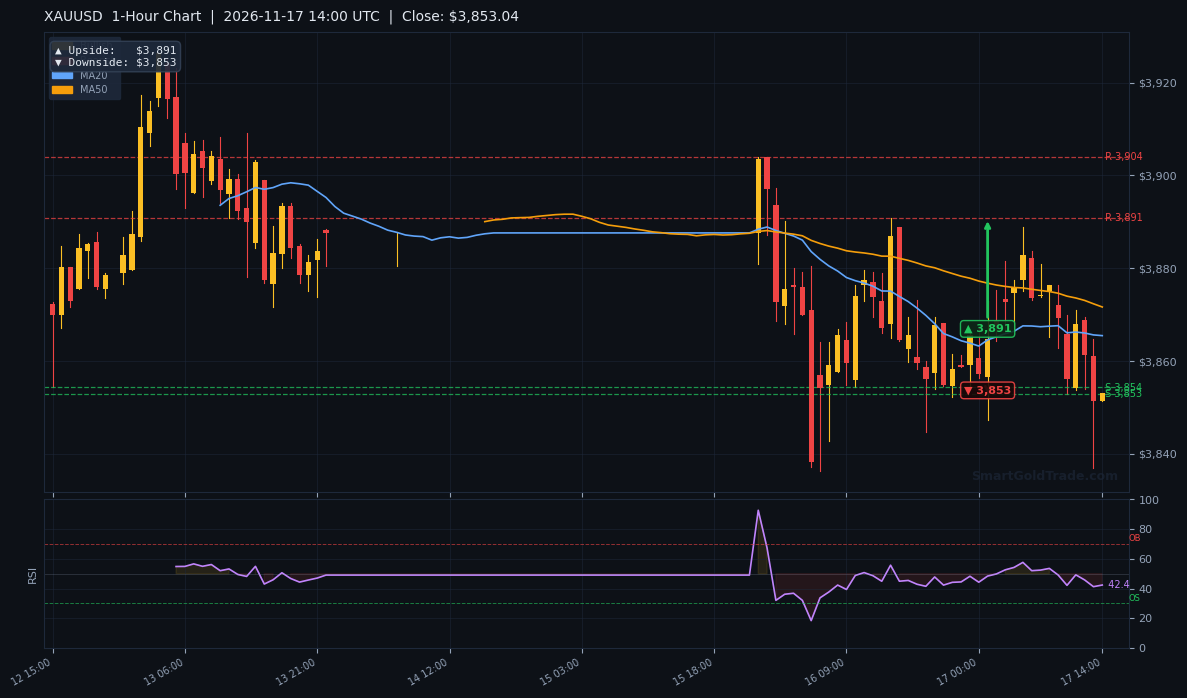
The gold price sits below every major moving average on the H1 chart. The EMA20 at $3,866.31 and EMA50 at $3,878.51 form a stacked ceiling, with the EMA200 far above at $3,956.68. The H4 close of $3,861.30 remains below its EMA50 at $3,950.54, and the daily close is well under the D1 EMA50 at $4,102.29.
This alignment confirms a bearish structure across timeframes. The sequence of lower highs and lower lows on the H1 swing count reinforces the downside bias until price reclaims the EMA20.
RSI and Momentum
The RSI(14) at 46.7 sits in neutral territory, leaving room for further downside before oversold conditions trigger a bounce. Stochastics at 40.8/43.7 are also mid-range. The MACD histogram at +0.14 is marginally positive, hinting at fading bearish momentum but not a confirmed reversal. ADX at 14.7 signals a weak, ranging market, so breakout trades need confirmation.
Key Price Levels
Immediate support rests at $3,852.51 (S1) and $3,841.15 (S2). Resistance is capped at $3,886.69 (R1) and $3,888.93 (R2). The VWAP at $3,866.77 and the 50% Fibonacci retracement at $3,863.92 sit just above spot, forming a confluence ceiling. The session's expected range based on ATR is roughly $3,848.61 to $3,878.51.
Fundamental Drivers
ING's Ewa Manthey and Warren Patterson noted gold rebounded modestly after its lowest close since September 2025, but expect volatility to persist with US yields and the dollar dominating direction. The team flagged tighter-for-longer Fed policy as a continuing headwind. Attention now turns to Wednesday's FOMC October minutes for clues on the rate path.
The CFTC report showed gold buying returned in the week to November 10, with speculators net long 179,548 contracts. That positioning is a double-edged sword: it confirms dip-buying interest but also leaves the market vulnerable to long liquidation if $3,852.51 fails. The news sentiment score of -0.14 reflects the mixed tone, with bearish Fed headlines offset by bullish bank calls like Morgan Stanley's long-term gold thesis.
Key Event to Watch
The FOMC October meeting minutes due Wednesday are the week's pivotal event. Any hint of a pause in the hiking cycle could trigger a sharp short-covering rally toward $3,886.69. Conversely, a hawkish tone would reinforce the bearish structure and put $3,841.15 in play.
Unified Technical & Fundamental Outlook
Both pillars are bearish and aligned. The technical score of -0.75 reflects the bearish H1 trend, price below the EMA200, and the EMA20/EMA50 stack overhead. The fundamental score of -0.28 captures rising real yields, a firm dollar, and negative news sentiment, partly offset by GLD inflows and net-long COT positioning.
The combined score of -0.51 with ALIGNED_BEARISH status means the path of least resistance remains lower. The strongest confluence is the moving-average ceiling between $3,866.31 and $3,878.51 paired with rising real yields. The main disagreement is the GLD inflow, which suggests some buyers see value here, but it is not enough to override the macro headwinds.
Devil's Advocate
The bearish bias would be invalidated by a decisive H1 close above the EMA50 at $3,878.51, which would break the stacked resistance and open a run toward $3,886.69. A softer-than-expected Retail Sales print or a dovish FOMC minutes surprise could trigger exactly that scenario.
Watch the $3,852.51 level closely. A failure to break it on the first test, combined with a MACD histogram turning more positive, would suggest sellers are exhausted. In that case, a short-covering rally toward the VWAP at $3,866.77 becomes the higher-probability path.
Trading Strategy for American Session
The preferred setup is a short on a failed retest of $3,866.31 to $3,869.29, the VWAP and Fibonacci confluence zone. Place the stop loss above the EMA50 at $3,878.51, roughly one ATR above entry. Target the first take profit at $3,852.51 (S1) and a second at $3,841.15 (S2).
For a long bias, wait for a confirmed H1 close above $3,878.51. Entry would be near $3,880.20 with a stop below $3,866.31 and a target at $3,886.69 (R1). Given the high-impact Retail Sales print inside the current hour, consider waiting for the data release before committing capital. A news protection tool can pause automated strategies during the print.
Position sizing should account for the $14.62 ATR. Risk no more than 1% of account equity per trade, and avoid adding to positions until the FOMC minutes clear on Wednesday.
Key Takeaways
- Gold price holds $3,861.34, but sits below the EMA20 at $3,866.31 and EMA50 at $3,878.51.
- RSI at 46.7 is neutral, leaving room for further downside before oversold conditions.
- Immediate support is $3,852.51 (S1), with $3,841.15 (S2) below; resistance at $3,886.69 (R1).
- Real yields at 2.91% and a 19-month-high dollar index at 122.7 remain the primary headwinds.
- Speculators are net long 179,548 contracts, leaving room for long liquidation if support breaks.
- The FOMC October minutes on Wednesday are the week's key catalyst for direction.
Conclusion
The gold price bias remains bearish with both technical and fundamental pillars aligned. The $3,852.51 level is the line in the sand for the American session; a break opens $3,841.15, while a reclaim of $3,866.31 would signal short-term exhaustion among sellers. Traders should respect the high-impact Retail Sales print and the upcoming FOMC minutes, which could shift the narrative quickly. Until the EMA50 at $3,878.51 is reclaimed, rallies remain selling opportunities. For those looking to trade the volatility with expert guidance, professional gold trading signals can help navigate the data-driven session.
Frequently Asked Questions
- What is the gold price right now?
- The gold price is $3,861.34 in the American session, down 0.176% on the H1 bar.
- What are the key support levels for gold?
- Immediate support is $3,852.51 (S1), followed by $3,841.15 (S2). A break below S2 would target the daily downside pivot at $3,832.45.
- What is the next resistance for XAU/USD?
- Resistance sits at $3,886.69 (R1) and $3,888.93 (R2). A close above R1 would shift the short-term bias neutral.
- Is now a good time to buy gold?
- With price below the EMA200 at $3,956.68 and real yields rising, the risk-reward favors waiting for a confirmed reclaim of $3,878.51 before considering long positions.
- What event could move gold this week?
- The FOMC October meeting minutes on Wednesday are the key catalyst. A dovish tone could push gold toward $3,886.69, while a hawkish tone could break $3,841.15.
Trading Gold (XAU/USD) carries significant risk of loss and is not suitable for all investors. This content is for informational purposes only and does not constitute financial advice. Always conduct your own research and trade responsibly.