
The gold price has tumbled to $4,507.83 on Tuesday, extending losses as optimism over a US-Iran diplomatic breakthrough reshapes cross-asset flows. The British pound surged against a softening dollar overnight after reports confirmed progress in nuclear talks, but gold failed to attract safe-haven bids. Instead, bullion broke below its short-term moving averages, handing the initiative to sellers. With the American session now underway, the metal is testing the patience of the bulls.
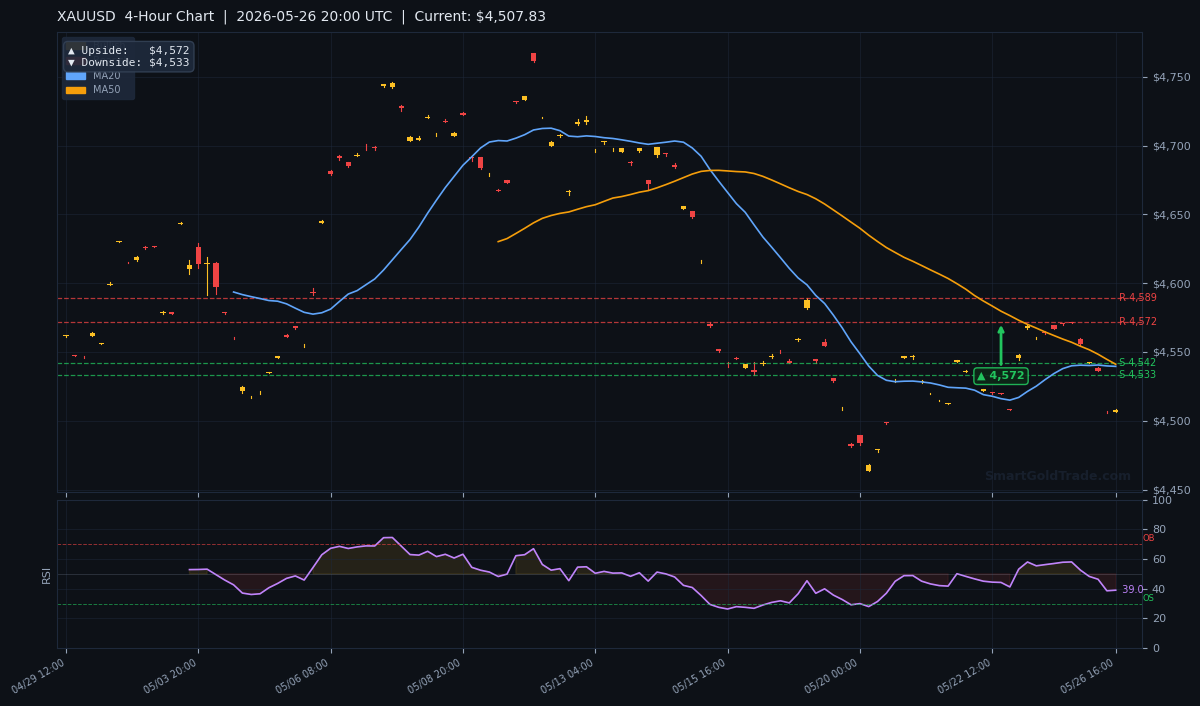
Monday's improvement in risk appetite, spurred by the prospect of de-escalation in the Middle East, erased demand for defensive assets. The greenback slipped, yet gold's traditional inverse correlation snapped. Now traders are asking whether $4,533—the 4-hour chart's next downside target—will hold or open the door to deeper losses.
Gold Market Overview
Macro Context
The US dollar index drifted lower after the weekend's US-Iran developments, while Treasury yields held steady near multi-week highs. A risk-on tone has taken hold across equity markets, crowding out the haven trade. Gold's failure to rally on a weaker dollar highlights the dominance of sentiment over traditional correlations.
Federal Reserve rate-cut expectations remain subdued, with markets pricing in a prolonged pause. This backdrop keeps the opportunity cost of holding non-yielding bullion elevated, adding to the downward pressure. Geopolitical risk, often a reliable bid for gold, has temporarily faded from the radar as diplomacy takes centre stage.
Session Outlook
The American session typically brings a surge in liquidity and volatility, and today's price action is likely to revolve around the $4,507 zone. If sellers manage to keep the gold price below the MA20 at $4,539.50, a retest of the 4-hour downside pivot at $4,533 becomes the base case. Bounces toward $4,540 will face stiff technical resistance.
Intraday traders are watching for any US economic data surprises, but the absence of top-tier releases shifts focus to flows and technicals. The expected daily range, based on the ATR(14) of $12.20, is $4,496 to $4,520, placing the current quote near the upper band, suggesting a potential fade.
Technical Analysis
Moving Average Structure
The gold price sits at $4,507.83, firmly below all three major moving averages. The MA20 at $4,539.50 and the MA50 at $4,541.06 have converged into a tight resistance cluster just above the market. The MA200 at $4,660.07 is even further away, confirming the bearish long-term picture. The EMA structure shows the MA20 trending below the MA50, a classic signal of short-term bearish momentum that has been building for several sessions.
For the first time in weeks, all three moving averages are sloping downward, reinforcing the idea that selling pressure is intensifying. Until the gold price reclaims at least the $4,540 zone, the path of least resistance remains lower.
RSI and Momentum
The 14-period RSI has dipped to 39.0, entering neutral territory but leaning towards the oversold region. This suggests that while bearish momentum is intact, the market is not yet at extremes where a sharp snap-back becomes probable. There is room for further downside before buyers step in aggressively.
Momentum traders will watch for a break below $4,500 to confirm an oversold reading that could trigger a short-squeeze. Conversely, any push above 45 on the RSI would indicate that the immediate selling pressure is fading.
Key Price Levels
Support levels begin at S2 of $4,541.85, which has already been breached, turning it into resistance. The next meaningful floor is the 4-hour pivot downside target at $4,533. Below that, the daily chart's downside projection sits at $4,667, though that level is more relevant for a multi-day move. On the upside, resistance starts at R2 $4,589.39, followed by R1 at $4,699.28.
The ATR(14) of $12.20 implies that intraday swings of $12–$15 are normal, giving day traders clear boundaries for stop-loss placement and profit targets.
Fundamental Drivers
The primary catalyst for today's move is the improving outlook for a US-Iran nuclear agreement, which has lifted the British pound to a multi-week high above 1.3500 against the dollar. Risk-on flows have flooded equity and commodity currencies, leaving gold as the odd asset out. Typically, a weaker dollar would support bullion, but the simultaneous decline in safe-haven demand overwhelmed that dynamic.
This decoupling is a clear signal that the gold price is responding more to the risk narrative than to currency mechanics. Traders who bet on gold purely because the DXY is falling are getting caught off guard. The move underscores the importance of reading sentiment rather than relying on a single correlation.
Key Event to Watch
Later this week, the US Core PCE Price Index—the Fed's preferred inflation gauge—is slated for Thursday. A higher-than-expected reading could reignite rate-hike fears, adding another headwind for gold. Conversely, a soft print might revive bets on a policy pivot, giving gold a lifeline. Until then, the gold price will likely dance to the beat of technical levels and real-time headlines.
Devil's Advocate
The bearish thesis relies heavily on the assumption that geopolitical calm persists. Any sudden re-escalation in the Middle East or a breakdown in US-Iran negotiations could flip the script instantly. A daily close above the $4,589.39 resistance (R2) would invalidate the immediate downtrend and pave the way for a retest of $4,668.
Furthermore, if the DXY breaks to fresh lows while Treasury yields retreat, gold could mount a sharp recovery even without geopolitical triggers. The key reversal zone lies between $4,533 and $4,541. A sustained break above this band with volume would shift the short-term bias back to neutral.
Trading Strategy for American Session
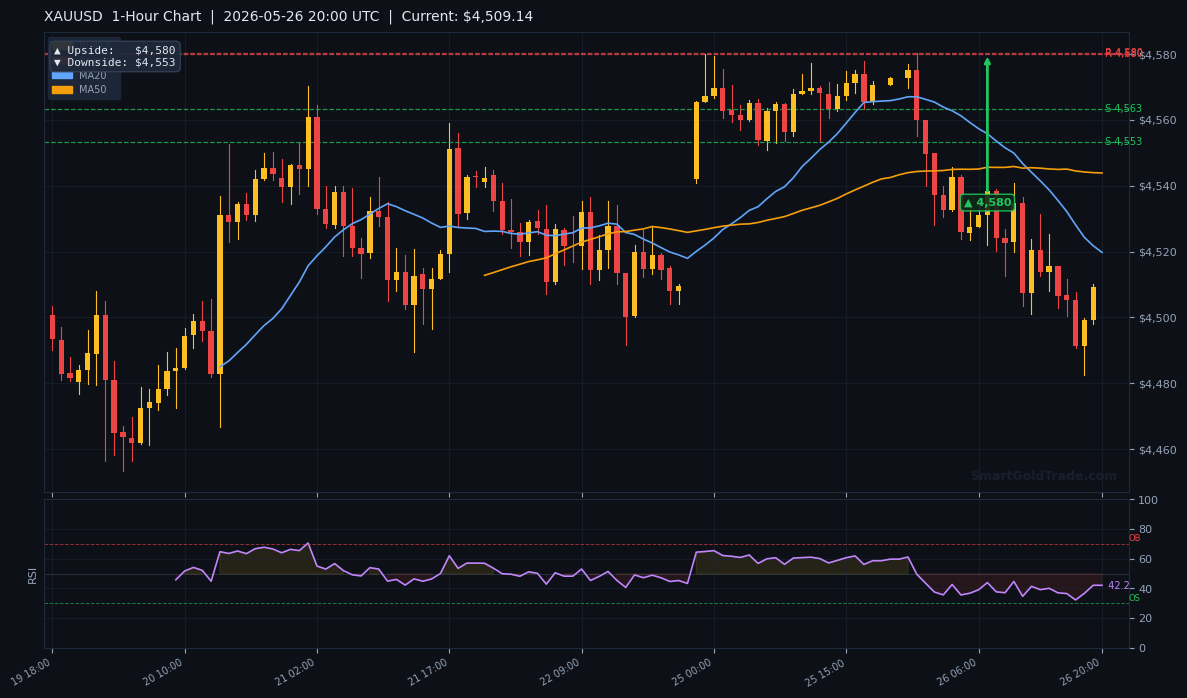
For traders who prefer interest-free spot gold trading, the current structure offers a well-defined short setup. The entry zone is between $4,530 and $4,540, coinciding with the breached S2 level and the MA20. A stop loss above the 4-hour upside pivot at $4,572 keeps risk within reasonable parameters—roughly $30–$40 from entry, or about 2.5 times the ATR.
Take-profit targets are spaced at $4,553 for the first partial and $4,533 for the final exit. This gives a risk-reward ratio of approximately 1:1.5, favouring disciplined execution. More conservative traders may want to wait for a confirmed break below $4,507 before entering short, using a trailing stop to lock in gains as the gold price approaches $4,500.
Key Takeaways
- Gold price trades at $4,507.83, below all three key moving averages, signalling strong bearish momentum.
- Immediate support lies at the 4-hour downside target of $4,533, with a break below opening the door to $4,500.
- Resistance is stacked at $4,539.50 (MA20) and $4,541.06 (MA50); a daily close above $4,589.39 negates the bearish outlook.
- RSI at 39.0 leaves room for further declines before oversold conditions trigger a bounce.
- The US-Iran deal optimism has disrupted the traditional gold-dollar inverse relationship, rewarding sellers.
- Intraday range expectations, per the $12.20 ATR, put the lower bound near $4,496, aligning with a potential target beyond $4,533.
Conclusion
The gold price is under heavy selling pressure as the American session picks up steam, with the risk-on mood sparked by US-Iran diplomacy showing no signs of fading. A break below $4,533 would mark a decisive shift in structure and could accelerate declines toward the psychological $4,500 handle. Until buyers reclaim the $4,540 region, the bias remains firmly bearish.
Looking ahead, Thursday's PCE data looms large, but for now, the technical landscape speaks louder than the macro narrative. Traders should stay nimble, respect the moving average resistance, and keep a close eye on any headlines that could upset the current calm.
Frequently Asked Questions
- What is the gold price today?
- As of May 26, 2026, the gold price stands at $4,507.83 per troy ounce during the American session, down sharply following US-Iran deal optimism.
- Why is gold falling even though the US dollar is weaker?
- The safe-haven premium has evaporated because the US-Iran agreement reduces geopolitical risk. Risk appetite is flowing into equities and risk-sensitive currencies, leaving gold unsupported despite a softer DXY.
- What are the key support levels for gold right now?
- The nearest support is the 4-hour pivot downside at $4,533, followed by the psychological $4,500 mark. Further out, the daily downside target at $4,667 becomes relevant if selling persists.
- What trading strategy works best for this American session?
- A short entry near the $4,530–$4,540 resistance zone, with a stop above $4,572 and targets at $4,553 and $4,533, aligns with the current bearish structure. Traders should adjust position size according to the ATR of $12.20.
Trading Gold (XAU/USD) carries significant risk of loss and is not suitable for all investors. This content is for informational purposes only and does not constitute financial advice. Always conduct your own research and trade responsibly.