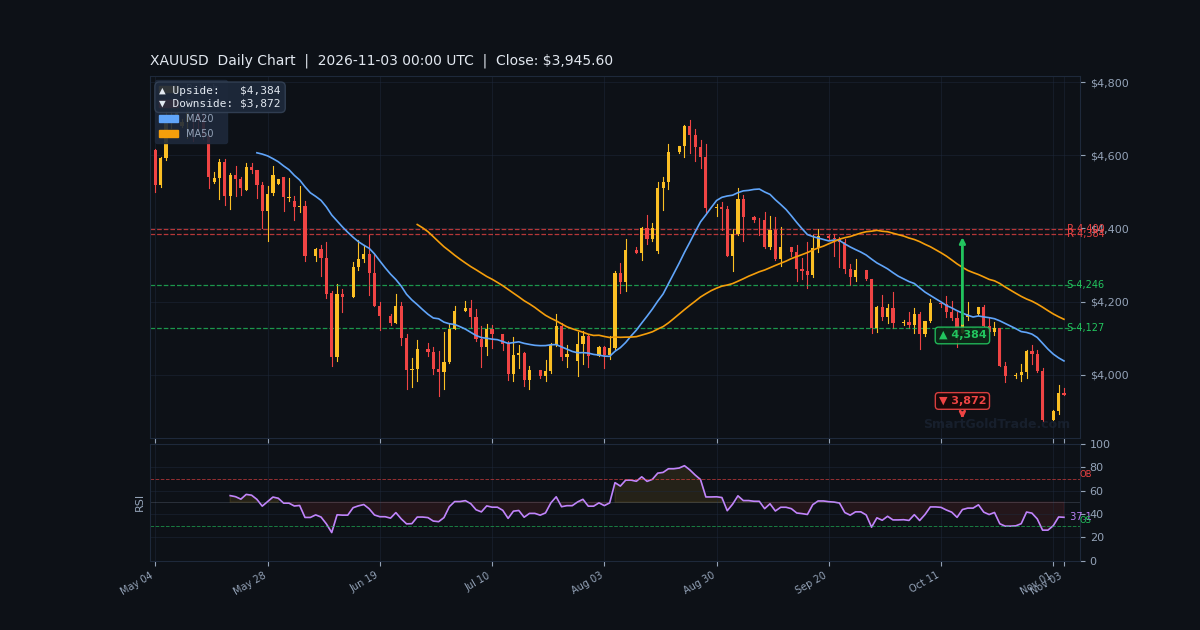
The gold price is holding near $3,950.80 in the Asian session, a modest -0.19% decline on the hour as traders pause ahead of this week's US midterm elections. Last week's manufacturing data showed unexpected strength, which initially capped gold's recovery, but the metal has found a floor above the $3,932 Bollinger lower band. With liquidity thin and no major US data due for another 83 hours, this session is about preparation, not chasing. The market is coiling between $3,945 and $3,960, and the next directional impulse will likely come from election headlines or a shift in Fed rate expectations.
Gold Market Overview
Macro Context
The broader macro backdrop remains mixed for the gold price. The broad dollar index is rising at 121.7, up 0.3% week-over-week, which is a headwind for dollar-denominated gold. However, 10-year TIPS real yields are falling to 2.60%, down 0.06% on the week, providing a tailwind for the metal. SPDR GLD holdings increased by 0.6 tonnes to 1,041.7 tonnes, signaling steady investment demand. COT data shows non-commercial speculators are net long 186,451 contracts, a supportive positioning backdrop. News sentiment is slightly negative at -0.07, reflecting cautious commentary from analysts like StoneX, who warn of a larger dive if yields rise further.
Session Outlook
Asian session liquidity is thin, and with no high-impact US releases until Friday's Non-Farm Employment Change, expect range-bound trading. The ATR of $15.37 suggests an hourly range of roughly $15, so moves outside $3,945 to $3,960 may lack follow-through. The key triggers today are any headlines from the US-Iran negotiations and early indications of election sentiment. Do not chase breakouts in this low-volume environment; wait for European or American session confirmation.
Technical Analysis
Moving Average Structure
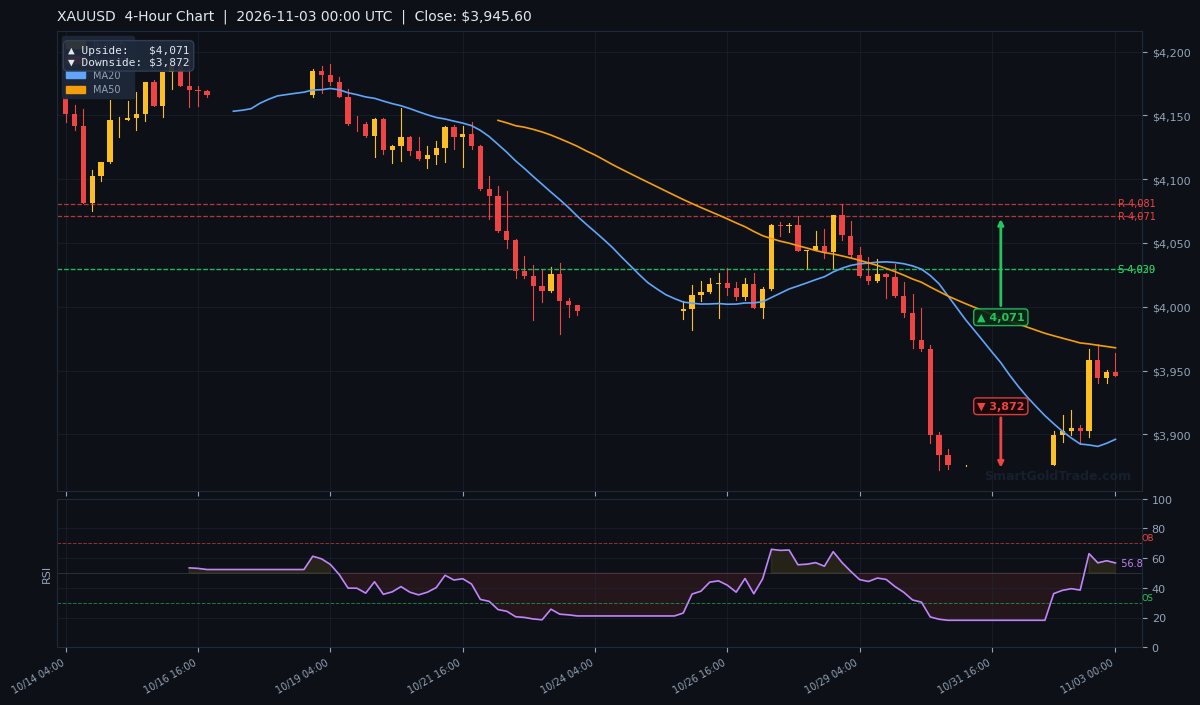
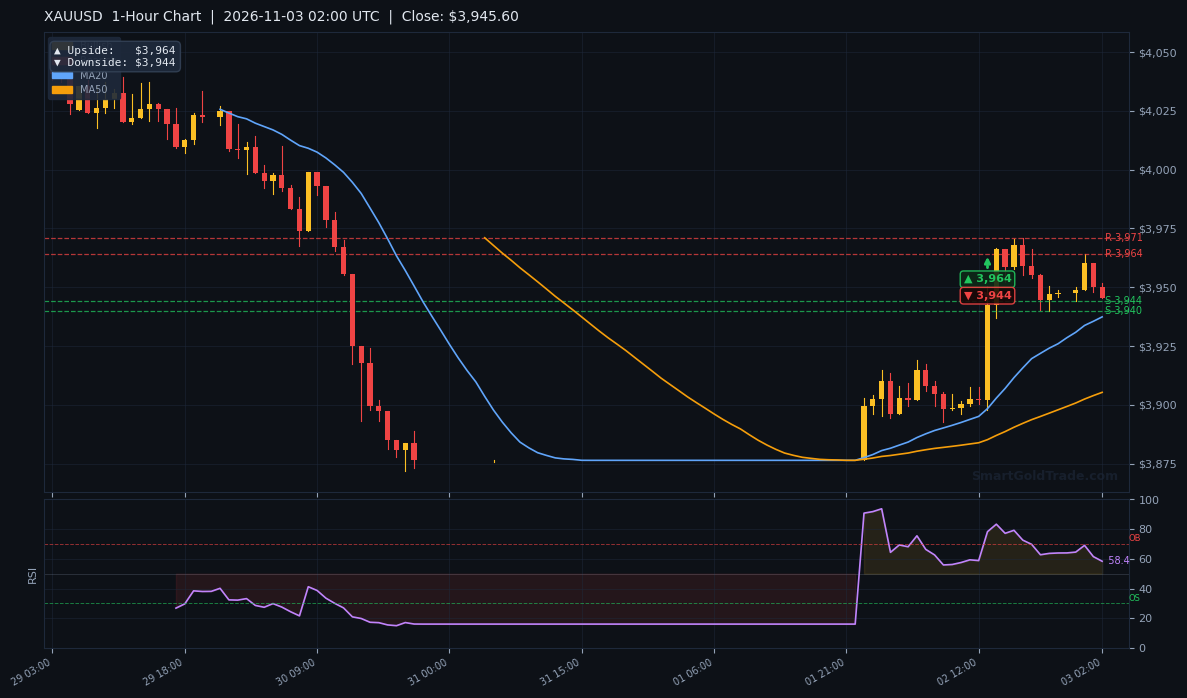
The gold price is trading below its 200-period EMA on the H1 chart at $4,013.98, confirming a bearish structure. The EMA20 at $3,939.71 is below the EMA50 at $3,948.82, a short-term bearish alignment. On the H4 chart, the close is below the EMA50 at $4,009.15, and the D1 close is below its EMA50 at $4,165.51. This layered resistance above the market means rallies will face selling pressure until price reclaims these levels.
RSI and Momentum
H1 RSI is at 55.9, in neutral territory, offering no immediate overbought or oversold signal. Stochastics are at 76.3/73.6, approaching overbought, which suggests limited upside before a pause. MACD is positive with a histogram of +3.49, indicating mild bullish momentum on the hour. ADX at 27.6 confirms a strong trend, but with +DI at 26.55 and -DI at 15.72, the bulls currently have the edge on this timeframe. Watch for RSI to break above 60 to confirm a push toward $3,970.
Key Price Levels
Immediate support sits at S1 $3,891.24, with stronger support at S2 $3,870.20. Resistance is at R1 $3,970.32 (also the prior day's high) and R2 $4,025.59. The Fibonacci 38.2% retracement at $3,940.11 is just below current price and has held as support. The expected session range based on ATR is roughly $3,935 to $3,966. The H1 chart shows a pivot upside target of $3,964 and a downside target of $3,944.
Fundamental Drivers
The gold price is being shaped by two competing forces. On one hand, falling oil prices linked to US-Iran diplomatic progress have eased inflation concerns, which reduces the urgency for aggressive Fed tightening and supports gold. On the other hand, the market still prices a 73% chance of a December rate hike, down from 80% a week ago, per CME FedWatch. The dollar's rise is a headwind, but HSBC analysts note that central bank purchases and fiscal uncertainty provide a solid floor. The upcoming US midterm elections in 13.2 hours add a layer of geopolitical risk premium, as a Democratic sweep could shift the narrative toward inflation and deficit concerns, historically bullish for gold.
Key Event to Watch
The single most important event this week is Friday's Non-Farm Employment Change, with a forecast of 65K versus the previous 29K. A weaker print would likely reduce rate hike odds and lift the gold price toward $3,970, while a stronger number could pressure it toward $3,932. Before that, the midterm elections will dominate headlines and could trigger safe-haven flows.
Unified Technical & Fundamental Outlook
The technical pillar is bearish with a score of -0.75, driven by the price being below the EMA200 and a bearish moving average alignment. The fundamental pillar is neutral with a score of +0.14, as falling real yields and GLD inflows offset dollar strength and negative sentiment. The combined assessment is bearish with a score of -0.31, and alignment is mixed. The strongest confluence is the bearish technical structure, which suggests rallies will be sold. However, the neutral fundamentals mean the downside is likely limited, and a break below $3,932 would require a fundamental catalyst. Traders should respect the bearish bias but remain flexible.
Devil's Advocate
What could invalidate the bearish bias? A decisive break above R1 at $3,970.32 would signal a shift in momentum, especially if accompanied by rising volume. The key reversal level is $3,970; a close above it on the H1 chart would flip the short-term trend bullish. Additionally, if the midterm elections produce a surprise outcome that sparks safe-haven demand, gold could rally sharply. The bearish scenario would be invalidated by a daily close above the EMA50 at $4,009. Until then, the path of least resistance remains lower.
Trading Strategy for Asian Session
Given the thin liquidity, a patient approach is warranted. For a short trade, consider an entry near $3,958 to $3,960 if price shows rejection, with a stop loss at $3,975 (roughly 1 ATR above entry) and take profit at $3,932. For a long trade, wait for a pullback to $3,940 (Fibonacci 38.2%) and enter on a bullish reversal signal, with a stop at $3,925 and target $3,964. Position sizing should be conservative; risk no more than 1% of capital. Avoid trading during the election results if volume spikes unexpectedly. For those looking to automate their strategy, Expert Advisor for gold can help execute trades with discipline.
Key Takeaways
- Gold price holds near $3,950.80, with a bearish technical structure below EMA200 at $4,013.98.
- Immediate support at $3,932.71 (Bollinger lower) and $3,891.24 (S1); resistance at $3,970.32 (R1).
- RSI at 55.9 is neutral; stochastics near overbought suggest limited upside.
- Fundamentals are neutral: falling real yields support, but dollar strength and negative sentiment weigh.
- US midterm elections in 13.2 hours and Friday's NFP are the key catalysts this week.
- ATR of $15.37 implies a session range of roughly $3,935 to $3,966.
Conclusion
The gold price is consolidating in a tight range as traders await the US midterm elections and Friday's jobs report. The technical bias is bearish, with price below key moving averages, but the fundamental backdrop is neutral, offering support from falling real yields and central bank demand. The key level to watch is $3,970 on the upside and $3,932 on the downside. A break below $3,932 could open the door to $3,891, while a reclaim of $3,970 would neutralize the bearish bias. For long-term investors, physical gold remains a hedge; consider purchase physical gold for portfolio diversification. Trade patiently and avoid chasing moves in thin liquidity.
Frequently Asked Questions
- What is the current gold price?
- The gold price is $3,950.80 as of the Asian session on November 3, 2026.
- What are the key support and resistance levels for gold?
- Key support is at $3,932.71 and $3,891.24. Resistance is at $3,970.32 and $4,025.59.
- How will the US midterm elections affect gold?
- A Democratic victory could raise inflation and deficit concerns, boosting safe-haven demand for gold. A Republican win might reduce fiscal uncertainty, potentially pressuring gold toward $3,932.
- Is gold a good buy now?
- With the technical bias bearish and fundamentals neutral, a cautious approach is wise. Wait for a pullback to $3,940 or a breakout above $3,970 for clearer signals.
- What is the forecast for gold this week?
- Expect range-bound trading between $3,932 and $3,970 until the NFP release on Friday, which could dictate the next directional move.
Risk Disclaimer: Trading Gold (XAU/USD) carries significant risk of loss and is not suitable for all investors. This content is for informational purposes only and does not constitute financial advice. Always conduct your own research and trade responsibly.