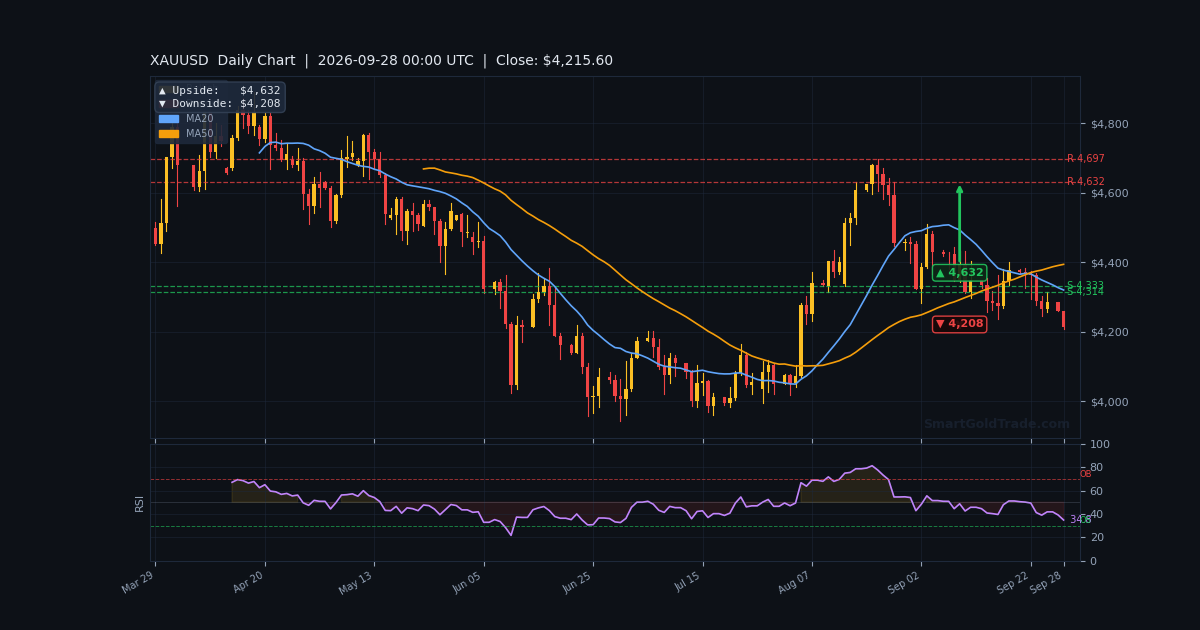
The gold price is trading at $4,216.11 during the Asian session, pinned just above the critical $4,206.07 support after a bruising 1.32% drop from the daily open at $4,272.44. Last week, hawkish remarks from Cleveland Fed President Beth Hammack and Philadelphia Fed President Anna Paulson pushed October hike odds to 65.9%, up from just 9.4% a month ago. That repricing hit non-yielding bullion hard.
Now the metal sits below every major moving average, with the daily RSI at 39.9 and the hourly RSI at 28.5 — technically oversold. Liquidity is thin this morning, and that means wide spreads and false breaks are the real risk, not the trend itself.
This session is about preparation, not prediction: watch whether $4,206.07 holds on a closing basis, because that single level decides whether we bounce toward VWAP or extend the slide.
Gold Market Overview
Macro Context
The dollar is doing the heavy lifting against gold right now. Fed officials spent last week reinforcing a higher-for-longer message, and money markets responded by pricing a 65.9% chance of an October hike. That lifted Treasury yields and pulled capital toward yield-bearing assets.
Geopolitics is the wildcard. President Trump rejected Iran's proposal to reopen the Strait of Hormuz, and he said Sunday he believes the war will be won "very soon." Renewed Middle East tension pushed oil higher, which feeds inflation expectations — and that, counterintuitively, supports the hawkish Fed case rather than gold.
OCBC strategists flagged the same tension, noting that oil and the rates response remain the main swing factors for bullion. Their read: any easing in energy prices or the dollar could help gold stabilise, while a further rise in yields keeps the near-term bias under pressure.
Session Outlook
The Asian session is quiet, and the ADX reading of 18.2 confirms it — this is a ranging market, not a trending one. Expect the metal to chop between $4,206.07 and $4,235.01 (VWAP) unless a headline lands.
Do not chase moves in this liquidity. Thin books produce fake breakouts, and the ATR of $18.07 tells you the realistic hourly range is small. Patience pays here; aggression does not.
Technical Analysis
Moving Average Structure
The trend is unambiguously bearish on the intraday frames. Price at $4,216.11 sits below the EMA20 at $4,270.61, the EMA50 at $4,281.53, and the EMA200 at $4,317.21. That stacked structure overhead is a wall of resistance.
On the higher timeframes the picture is identical: the H4 EMA200 rests at $4,346.93 and the D1 EMA200 at $4,318.51. Until price reclaims at least the EMA20, every bounce is a counter-trend move, not a reversal.
RSI and Momentum
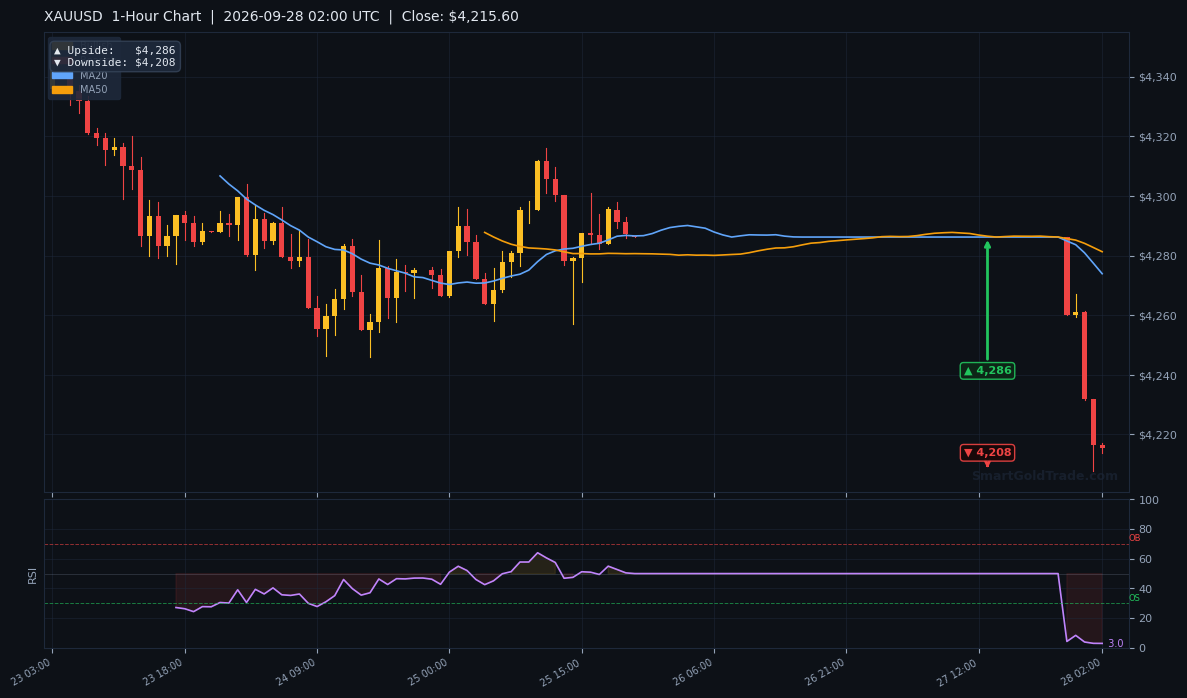
The hourly RSI(14) at 28.5 is oversold, and the Stochastic at 7.7/12.7 is deeply stretched to the downside. That combination often precedes a mechanical bounce — but oversold is not a buy signal on its own.
The MACD at -9.57 with a histogram of -7.54 confirms momentum is still negative. The daily RSI at 39.9 leans lower, meaning the bigger frame has not yet exhausted its selling pressure. Treat any bounce as corrective until momentum crosses back above zero.
Key Price Levels
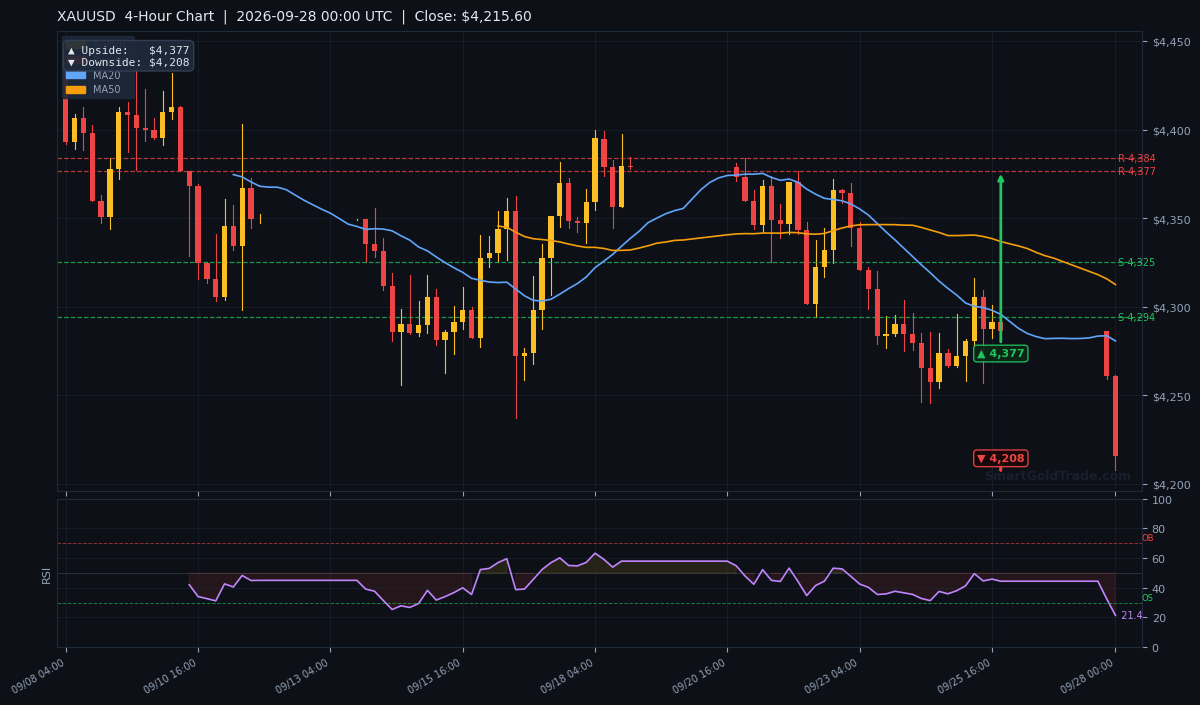
Support sits at $4,206.07 (S1), with the prior week's low at $4,244.27 already lost. Resistance begins at $4,288.56 (R1) and extends to $4,295.90 (R2). The ATR of $18.07 frames the expected hourly range.
| Timeframe | Upside Target | Downside Target |
|---|---|---|
| Daily | $4,632 | $4,208 |
| 4-Hour | $4,377 | $4,208 |
| 1-Hour | $4,286 | $4,208 |
Fundamental Drivers
The dominant driver remains the Fed. Following September's quarter-point hike into the 3.75%–4.00% range, officials signalled more may come. Governor Michael Barr said further adjustments are "likely to be needed," and both Barkin and Collins backed the recent increase.
Higher rates raise the opportunity cost of holding gold, which pays no yield. That is the core mechanism behind this week's slide. The dollar's strength, reinforced by rising Treasury yields, compounds the pressure.
On the geopolitical side, the Strait of Hormuz standoff and Trump's comments on Iran keep a safe-haven bid alive — but right now that bid is flowing into the dollar, not gold. That divergence matters. If Middle East tensions escalate sharply, gold's haven appeal could reassert itself, and that is the scenario bears should respect.
Key Event to Watch
The single most important event this week is the Fed's rate decision, which FXStreet flags as the driver of XAU/USD's next move. With markets pricing a 65.9% chance of an October hike, any shift in that pricing — hawkish or dovish — will set gold's direction into the weekend. A confirmation of hawkish intent likely pressures $4,206.07; a softer tone could trigger a sharp short-covering bounce toward $4,288.56.
Devil's Advocate
The bearish case has one obvious flaw: the hourly RSI at 28.5 and Stochastic at 7.7 are deeply oversold. Oversold conditions in a thin Asian book can snap higher violently on a single headline.
The key reversal level is $4,206.07. A clean hourly close below it opens $4,208 and then the deeper daily downside target at $4,208 on the pivot map. But if price instead reclaims $4,235.01 (VWAP) and holds, the oversold bounce could extend to $4,288.56.
Any dovish Fed leak, a sudden oil spike, or a Middle East escalation would flip this trade against the shorts. Size accordingly.
Trading Strategy for Asian Session
Given the weak ADX and thin liquidity, the higher-probability play is to sell rallies into resistance rather than chase the breakdown. The entry zone sits between $4,235.01 (VWAP) and $4,270.61 (EMA20), where sellers have repeatedly stepped in.
Place your stop loss above the EMA50 at $4,281.53, roughly one ATR ($18.07) beyond entry, to avoid noise. First take profit lands at $4,206.07 (S1). A break there targets the $4,208 pivot downside level.
For the counter-trend long, wait for a confirmed hourly close above $4,235.01 with RSI turning up from oversold. Target $4,288.56 (R1), with a stop below $4,206.07. Risk-reward favours the short side until the EMA20 is reclaimed.
If you prefer a hands-off approach while you sleep, automated candlestick pattern detection can flag supply and demand zones on the gold chart without you staring at the screen. Just remember: no tool replaces a stop loss.
Key Takeaways
- Gold price sits at $4,216.11, down 1.32% from the daily open at $4,272.44.
- Price is below the EMA20 ($4,270.61), EMA50 ($4,281.53), and EMA200 ($4,317.21) — bear structure intact.
- Hourly RSI at 28.5 is oversold, hinting at bounce potential, but MACD at -9.57 keeps momentum negative.
- Critical support is $4,206.07; resistance begins at $4,288.56 and $4,295.90.
- ATR of $18.07 defines the expected hourly range — thin Asian liquidity warns against chasing.
- October Fed hike odds at 65.9% remain the dominant headwind for bullion this week.
Conclusion
The gold price bias stays bearish while price holds below the EMA20 at $4,270.61. The immediate battle is $4,206.07 — hold it, and an oversold bounce toward $4,288.56 is possible; lose it, and the slide extends toward the $4,208 pivot downside.
This is a session for patience, not conviction. Liquidity is thin, the ADX is weak, and the Fed decision looms large. Watch the dollar and Treasury yields for the first real signal. If you want to build a longer-term position rather than trade the noise, Shariah-compliant gold investment pools offer a steadier route with quarterly audits.
Frequently Asked Questions
- Is gold oversold enough to buy right now?
- The hourly RSI at 28.5 is oversold, but oversold is not a buy signal alone. Wait for a confirmed hourly close above $4,235.01 (VWAP) before considering longs, with a stop below $4,206.07.
- What is the key support level for gold today?
- $4,206.07 (S1) is the make-or-break level. A clean hourly close below it opens the $4,208 downside pivot and extends the bearish structure.
- Where is gold resistance in this session?
- Resistance starts at $4,288.56 (R1), then $4,295.90 (R2). The EMA20 at $4,270.61 is the first hurdle bulls must clear.
- How will the Fed decision affect the gold price?
- With October hike odds at 65.9%, a hawkish confirmation pressures $4,206.07. A softer tone could trigger short-covering toward $4,288.56.
- What is the expected trading range for gold today?
- The ATR of $18.07 defines the hourly range. Expect chop between $4,206.07 and $4,235.01 unless a headline breaks the range.
Trading Gold (XAU/USD) carries significant risk of loss and is not suitable for all investors. This content is for informational purposes only and does not constitute financial advice. Always conduct your own research and trade responsibly.