
As of Friday, June 12, 2026, spot gold (XAU/USD) trades at $4,216.97, capping a week of heavy losses. Our gold price forecast next week (June 15–19) weighs the oversold technicals, upcoming economic catalysts, and key levels traders need to watch. Will gold’s decline extend toward $4,100, or is a corrective bounce imminent?
Last Week in Review
Price Action Recap
Gold opened last Monday near $4,350 and initially held steady. By Wednesday, a hotter-than-expected US CPI print for May and hawkish Fed rhetoric sent the dollar and bond yields soaring. The metal collapsed through the $4,300 psychological support, plunging to a weekly low of $4,205 on Thursday before a modest late-day recovery. It closed Friday at $4,216.97, a weekly loss of roughly 3.1%. The bearish engulfing candle on the weekly chart underscores persistent selling pressure.
Key Events That Moved Gold
The May US CPI rose 0.5% month-over-month, pushing the annual rate to 3.8%. Coming on the heels of strong payroll data, this cemented expectations that the Federal Reserve will keep rates higher for longer. Additionally, comments from Fed officials emphasizing “data dependency” rather than imminent cuts further weighed on non-yielding gold.
Weekly Close Analysis
Gold closed at $4,216.97, well below the 20-, 50-, and 200-period moving averages on the daily chart. The weekly candle is a large bearish engulfing candle, closing near its low with almost no lower wick. Sellers remain in control, and rallies are likely to attract fresh selling unless we see a clear reversal signal.
Next Week Economic Calendar & Gold Impact
The following high-impact events will shape gold’s trajectory this week. Traders should adjust positions before each release.
| Day | Event | Forecast | Previous | Gold Impact |
|---|---|---|---|---|
| Mon June 15 | Eurozone Final CPI (May) y/y | 2.6% | 2.5% | Higher CPI → EUR strength → USD weakness → bullish gold |
| Tue June 16 | US Retail Sales (May) m/m | 0.3% | 0.1% | Strong data → bearish gold; weak → bullish |
| Wed June 17 | FOMC Meeting Minutes | - | - | Hawkish tone → bearish; dovish tone → bullish |
| Thu June 18 | US Initial Jobless Claims | 235K | 230K | Above forecast = risk-off, bullish gold |
| Fri June 19 | US Existing Home Sales (May) | 4.20M | 4.08M | Strong data → bearish; weak → bullish |
Tip: High-impact releases can create violent intraday swings. Consider reducing position size ahead of the FOMC minutes to avoid whipsaws.
Technical Analysis
Moving Average Structure
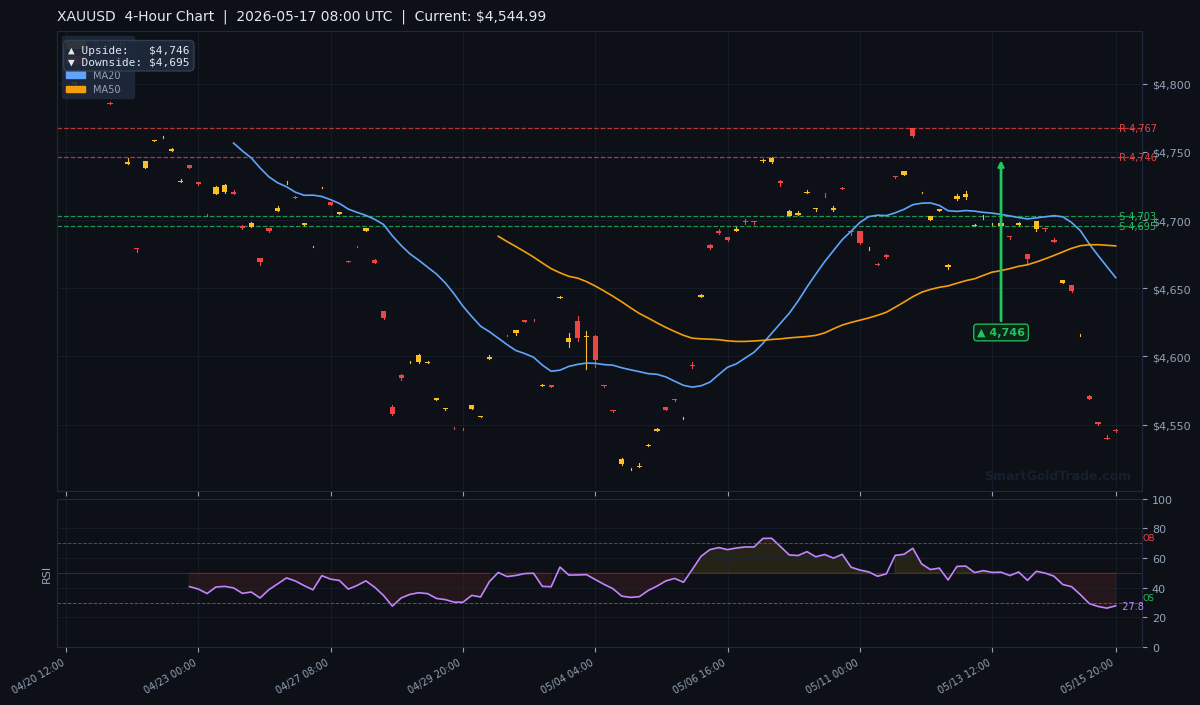
The H4 chart shows a textbook bearish alignment: price at $4,216.97 sits well beneath the MA20 ($4,284.50), MA50 ($4,337.20), and MA200 ($4,395.00). A death cross of the MA50 below the MA200 two weeks ago reinforces the long-term bearish signal. Any rallies that fail to reclaim the MA20 are short-selling opportunities.
RSI and Momentum
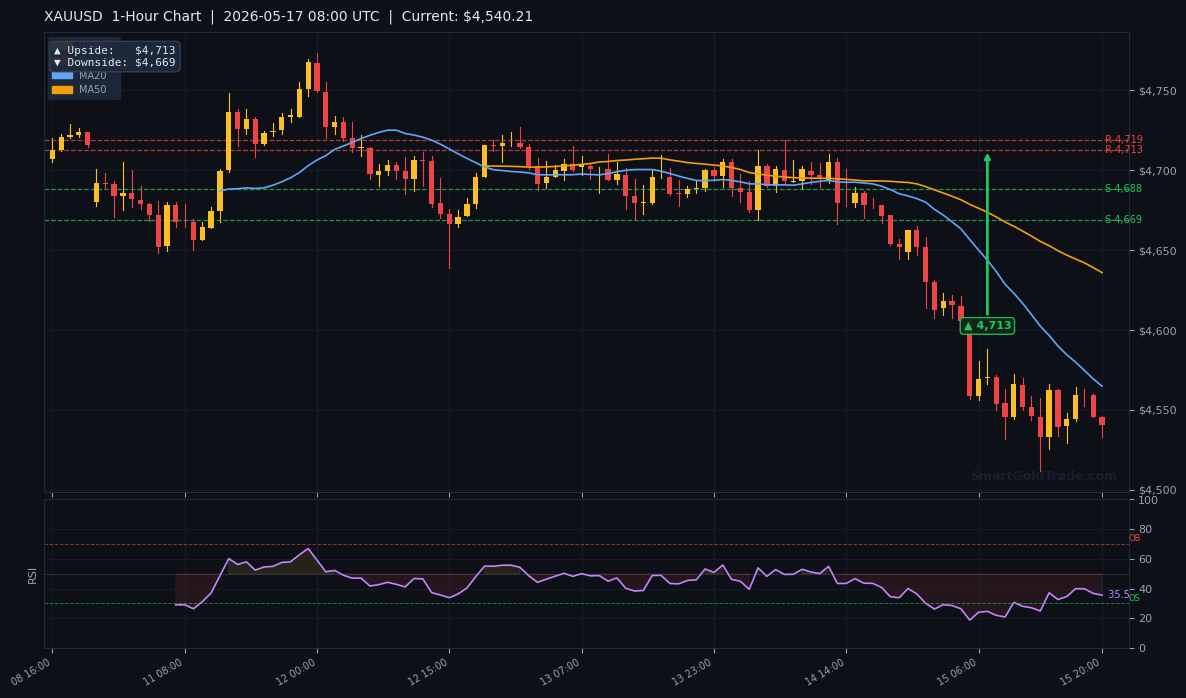
The 14-period RSI reads 24.5, deep in oversold territory. This suggests the sell-off may be overextended, and a corrective bounce is plausible soon. In strong downtrends, however, RSI can stay oversold for extended periods, so traders should wait for a confirmed bullish price structure before going long.
Key Support and Resistance Levels
With price below all prior-week pivot levels, all broken supports now act as resistance. The first notable resistance is the H1 upside target at $4,280, followed by the H4 target at $4,310 and the daily upside target at $4,390. On the downside, immediate support rests at $4,200, the psychological round number. Below that, $4,150 and $4,100 come into play.
Based on the 14-period ATR of $22.50, the expected daily range is about $22–$25, translating to a weekly projected range of $110–$125.
Technical Confluence Zones
The $4,200 level is not only psychological support; it also aligns with the 161.8% Fibonacci extension of the previous correction and the lower boundary of the long-term ascending channel from March. A breakdown here would have bearish implications. On the upside, $4,280 coincides with broken support-turned-resistance, the 100% Fibonacci retracement level, and the H1 MA20. This cluster makes it a pivotal resistance for any bullish correction.
Gold Price Forecast Next Week: Trading Scenarios
Bullish Scenario (probability 35%)
Trigger: A clear bounce from the $4,200–$4,180 support zone with a bullish engulfing candle on the H1 or H4 chart.
Entry: Near $4,205–$4,215.
Target 1: $4,250 (minor resistance). Target 2: $4,280 (1H upside target). Target 3: $4,310 (4H target).
Stop Loss: Below $4,180.
Bearish Scenario (probability 55%)
Trigger: A break below $4,200 (last week’s low and psychological support) confirmed by a strong bearish close on the H4 chart.
Entry: On a retest of $4,195–$4,200.
Target 1: $4,150 (next support). Target 2: $4,100 (major swing support from March lows).
Stop Loss: Above $4,230.
Neutral / Range-Bound Scenario (probability 10%)
Trigger: Price consolidates between $4,200 and $4,280 without a decisive breakout.
Strategy: Sell near $4,270–$4,280 resistance, buy near $4,205–$4,210 support. Use tight stop losses and take profits quickly on mean reversion.
Risk Factors to Watch
A hawkish surprise in the FOMC minutes or strong US retail sales could accelerate the sell-off toward $4,100. Conversely, a dovish Fed tilt or a geopolitical shock—such as renewed trade tensions or Middle East escalation—could trigger a sharp short-covering rally. The bearish view is invalidated by a daily close above $4,310; the bullish view is negated by a daily close below $4,180.
Shariah-Compliant Gold Strategies for the Week Ahead
For traders who want to avoid interest and leverage, SmartGoldTrade’s halal gold trading platform offers spot trading with full physical ownership—ideal for short-term plays on oversold bounces. You can also mirror seasoned traders through the platform’s copy trading feature without compromising your faith. If you prefer a longer-term, income-focused approach, consider Islamic partnership investment pools that earn profit shares from physical gold exposure, audited quarterly for Shariah compliance. Both tools let you participate in gold’s moves while staying true to your financial principles.
Key Takeaways
- Gold opens the new week at $4,216.97, oversold RSI at 24.5.
- First resistance at $4,280 (H1 upside target).
- Immediate support at $4,200, a break exposes $4,150.
- FOMC minutes on Wednesday are the top event risk.
- Bearish bias persists unless price reclaims $4,310.
- Weekly target range: $4,100 to $4,310.
Conclusion
Gold’s technical picture remains firmly bearish with the price below all key moving averages. However, the deeply oversold RSI suggests a corrective bounce may materialize in the near term before the next leg lower. Our gold price forecast next week expects a test of $4,200 support; a break below would open the door to $4,150 and $4,100. On the upside, a sustained push above $4,280 would shift the bias to neutral. The FOMC minutes will be the decisive catalyst. For a compliant way to act on these levels, explore SmartGoldTrade’s halal trading and Shariah-compliant investment pools.
Frequently Asked Questions
- What is the gold price forecast for next week?
- Gold is expected to trade between $4,100 and $4,310, with a bearish bias. Oversold conditions may trigger a short-term bounce, but the trend remains down until the price reclaims $4,310.
- What is the key support level for gold this week?
- Immediate support is at $4,200 (last week’s low). A break below could target $4,150 and then $4,100.
- What is the key resistance level for gold this week?
- The H1 upside target at $4,280 is the first resistance. Above that, $4,310 (H4 target) and $4,390 (daily target) come into play.
- How will the FOMC minutes affect gold?
- Hawkish minutes would strengthen the dollar and push gold lower toward $4,200 and $4,150. Dovish minutes could fuel a short-covering rally toward $4,280.
- Is gold oversold?
- Yes, the 14-period RSI is at 24.5, indicating oversold conditions. In strong downtrends oversold can persist, so wait for bullish confirmation before going long.
- What is the best strategy for trading gold this week?
- Consider selling on rallies to $4,280 with a stop above $4,310, or buying a confirmed bounce from $4,200 with a stop below $4,180. Always use proper risk management. For precise entry and exit levels, explore professional gold trading signals that deliver real-time alerts.
Trading Gold (XAU/USD) carries significant risk of loss and is not suitable for all