The gold price is holding at $4,353.36 in early Asian trade, and the calm is deceptive. Friday's hot US inflation report landed, and the metal closed the week on its back foot. Now the market sits in a tight pocket between $4,341 support and $4,371 resistance, waiting on Wednesday's Federal Reserve decision.
Liquidity this morning is thin. Spreads are wider than normal. That combination punishes anyone who chases a breakout before London arrives. This session is about preparation, not action.
Below, we map the exact levels that matter, the macro forces pressing on gold, and the two scenarios that would flip the current short-term bias.
Gold Market Overview
Macro Context
The dollar is firm. Friday's CPI print showed headline inflation at 3.4% year-on-year and core at 0.3% month-on-month, above the 0.2% consensus. That was enough to push CME FedWatch odds of a quarter-point hike to roughly 91%, up from 72% before the PPI release.
Treasury yields have firmed in response, and that raises the opportunity cost of holding a non-yielding asset. Gold's failure to reclaim its EMA200 on the daily chart fits that backdrop.
Geopolitics is the counterweight. Over the weekend, Houthi forces struck a military base in southern Saudi Arabia, and an Iranian cargo vessel was hit in the Strait of Hormuz. Safe-haven demand is real, but it is not yet strong enough to override the rate story.
Session Outlook
Asian hours typically produce narrow ranges when there is no regional data on the calendar. With ADX at 18.5, the market is ranging, not trending. Expect price to oscillate between $4,341 and $4,362 unless a headline lands.
The key trigger today is any escalation in the Middle East. A second headline of that kind could push gold through $4,362 quickly, but without volume behind it, those moves tend to fade.
Technical Analysis
Moving Average Structure
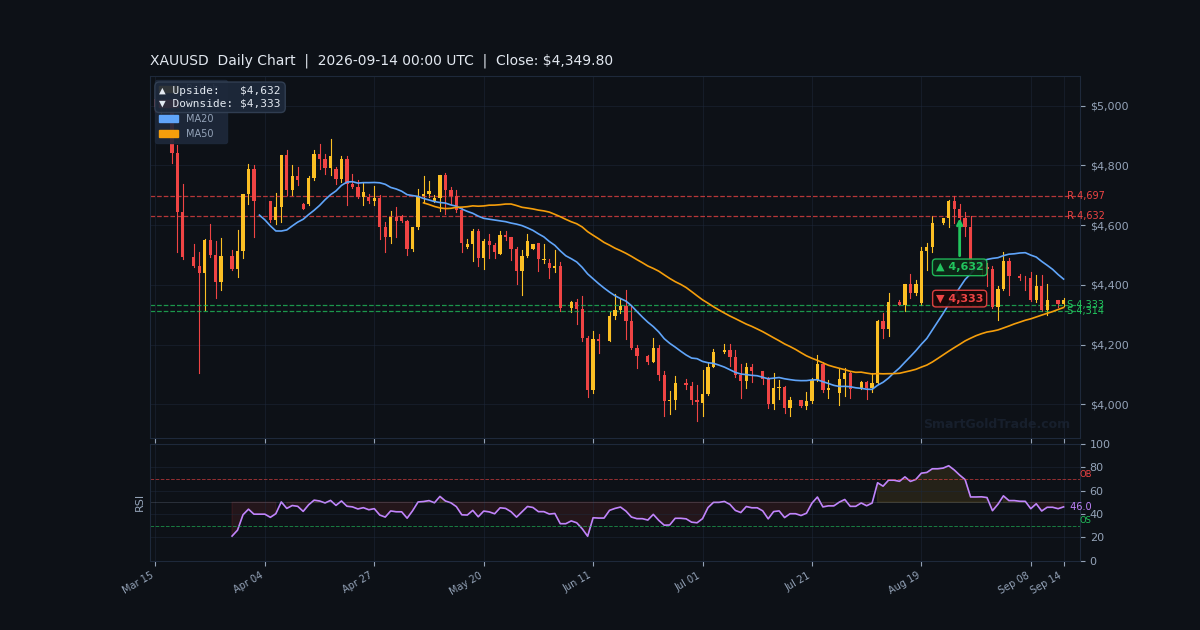
The EMA20 sits at $4,350.22, just below price. The EMA50 is at $4,360.23, and the EMA200 is at $4,402.56. Price is trading below the 200-period average, which keeps the short-term structure bearish.
That said, the EMA20 is acting as a floor right now. As long as gold holds above $4,350, the downside looks contained. A clean break below it opens the door to the lower Bollinger band at $4,318.78.
RSI and Momentum
RSI(14) is at 50.5, dead centre of the neutral range. There is no overbought or oversold signal here. Stochastic reads 44.9/42.9, also mid-range.
MACD is at -3.08 with a histogram of -0.80. The negative reading confirms mild bearish momentum, but the small histogram suggests the selling pressure is not accelerating. This is a market waiting for a catalyst, not one that is breaking down.
Key Price Levels
Immediate support rests at $4,341.26 (S1), with a deeper floor at $4,324.68 (S2). To the upside, $4,362.06 (R1) is the first hurdle, followed by $4,371.84 (R2).
The ATR(14) is $20.53, or 0.47% of price. That is the expected hourly range. In thin Asian conditions, expect the lower half of that band unless a news catalyst hits.
VWAP at $4,340.80 sits just above S1, reinforcing that zone as the session's true floor.
| Timeframe | Upside Target | Downside Target | Bias |
|---|---|---|---|
| Daily | $4,632 | $4,333 | Neutral-bearish |
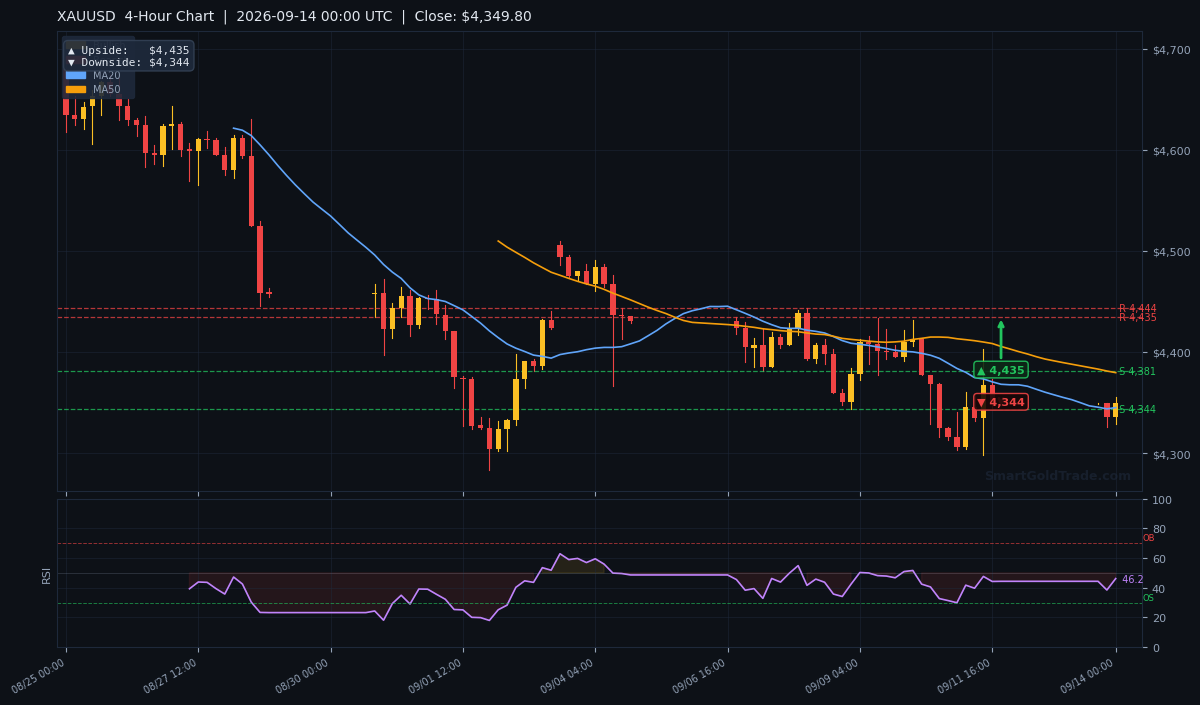
| 4-Hour | $4,435 | $4,344 | Bearish |
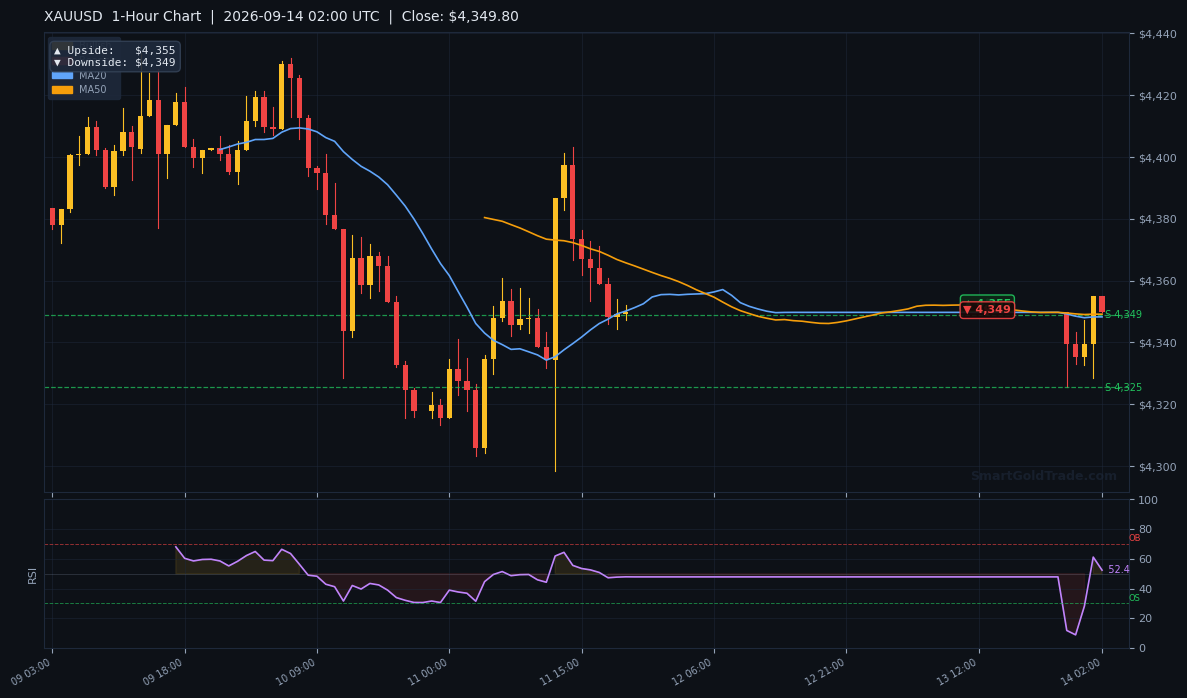
| 1-Hour | $4,355 | $4,349 | Ranging |
Fundamental Drivers
The dominant driver this week is the Fed. Wednesday's decision is now priced at roughly 91% odds of a 25 basis point hike. That is a near-certain outcome in market terms, which means the real risk is not the hike itself but the guidance that follows.
If the Fed signals one more hike before year-end, gold faces renewed pressure toward $4,324. If the language softens, the metal could snap back toward $4,371 and beyond.
On the geopolitical side, the Strait of Hormuz incident over the weekend is worth tracking. Any further disruption to shipping lanes would push oil higher and drag gold along with it, at least temporarily. Traders who prefer to sit out these headline windows can use automated news event trading protection to pause exposure during the release.
Key Event to Watch
Wednesday's FOMC statement and press conference is the single most important event this week. The rate decision itself is largely priced. The dot plot and Powell's tone are what will move gold.
A hawkish surprise sends the gold price toward $4,341 and possibly $4,324. A dovish lean opens $4,371 and then $4,402, the daily EMA200.
Devil's Advocate
The bearish case rests on the Fed staying hawkish and the dollar holding its bid. But that view has a clear failure point. If gold closes an H1 candle above $4,362 (R1) with volume, the short-term bearish structure breaks.
The next confirmation would be a push through $4,371.84 (R2), which would put the daily EMA200 at $4,402.56 back in play.
A second scenario that flips the trade is a sudden escalation in the Middle East. Safe-haven flows can override rate expectations for days at a time. Anyone short gold into a weekend of geopolitical risk is taking a real chance.
Trading Strategy for Asian Session
The bias this session is neutral-to-bearish, but the market is ranging. That means the strategy is to sell rallies into resistance and buy dips into support, not to chase breakouts.
For a short setup, look for price to rally into $4,360–$4,362. Enter on rejection, with a stop above $4,371.84 (R2). That is roughly one ATR of risk. First target is $4,341.26 (S1), second target $4,324.68 (S2).
For a long setup, wait for a dip into $4,341–$4,344. Enter on a bullish reversal candle, with a stop below $4,324.68. Targets are $4,362 and $4,371.
Position size should be reduced in Asian hours. The ATR of $20.53 is the expected hourly range, but thin liquidity can produce false breaks. If you want a rules-based approach, a halal gold trading account with no leverage removes the temptation to oversize.
No trade is also a valid decision. If price stays glued between $4,349 and $4,355, there is nothing to do. Wait for London.
Key Takeaways
- Gold price sits at $4,353.36, below the daily EMA200 at $4,402.56 — bearish structure intact.
- Immediate support is $4,341.26 (S1); deeper floor at $4,324.68 (S2).
- First resistance is $4,362.06 (R1), then $4,371.84 (R2).
- RSI at 50.5 and ADX at 18.5 confirm a ranging, not trending, market.
- Fed odds of a 25bp hike sit near 91% — Wednesday's guidance is the week's real catalyst.
- ATR of $20.53 defines the expected hourly range; size positions accordingly.
Conclusion
The gold price is coiled between $4,341 and $4,371, waiting for the Fed. The short-term bias leans bearish while price trades below $4,402.56, but the range-bound ADX argues against aggressive positioning.
The level that decides the week is $4,362. Hold below it and sellers stay in control. Reclaim it with conviction and the path to $4,402 reopens.
For now, patience pays better than prediction. Watch the headlines, respect the levels, and let London set the tone before committing size.
Frequently Asked Questions
- What is the gold price right now?
- The gold price is $4,353.36 as of the 02:00 UTC H1 close on September 14, 2026, in the Asian session.
- Is gold bullish or bearish this week?
- Short-term bias is bearish while price trades below the daily EMA200 at $4,402.56. A close above $4,362 would neutralise that view.
- What are the key support and resistance levels for gold today?
- Support sits at $4,341.26 (S1) and $4,324.68 (S2). Resistance is at $4,362.06 (R1) and $4,371.84 (R2).
- How will the Fed decision affect the gold price?
- A hawkish outcome pushes gold toward $4,341 and possibly $4,324. A dovish lean opens $4,371 and then $4,402.
- Should I trade gold during the Asian session?
- Only with reduced size. Thin liquidity and an ATR of $20.53 make false breakouts more likely before London opens.
Trading Gold (XAU/USD) carries significant risk of loss and is not suitable for all investors. This content is for informational purposes only and does not constitute financial advice. Always conduct your own research and trade responsibly.