The gold price currently trades at $4,055.52 (Friday, July 25), but the market is already bracing for Monday’s Asian session, where support near $4,013 will be critical. Two days before the FOMC decision, liquidity is scant and desk chatter is light. Last week’s steady US durable goods orders kept the dollar bid, but the move lacked conviction above 105 on the DXY. With no tier-one data today, price action will be dictated by position-squaring and thin-order-book noise. The setup isn’t about chasing headlines; it’s about identifying where the gold price can finally break its recent freefall — and mapping a low-risk entry before the Fed reprices expectations.
Asian hours often deliver false breaks and whipsaw moves. That makes today a planning session, not an aggression session. If you treat this window as a high-probability scalping arena, you’ll find a clear path. If you try to force momentum, you’ll get chopped. Let’s walk through the levels, the structure, and the one trade that aligns risk with reward.
Gold Market Overview
Macro Context
The US dollar index has consolidated near 105.2 since mid-July, and the 10-year Treasury yield sits around 4.20%, both applying a steady lid on the gold price. Fed funds futures price a 98% probability of no change at the July 29 meeting, so the spotlight falls squarely on the statement’s language — any hint of a September cut, or a pushback against it, will swing gold sharply. Meanwhile, simmering geopolitical friction in the South China Sea keeps a floor under haven demand, but it hasn’t been enough to offset the heavy US rate environment.
Session Outlook
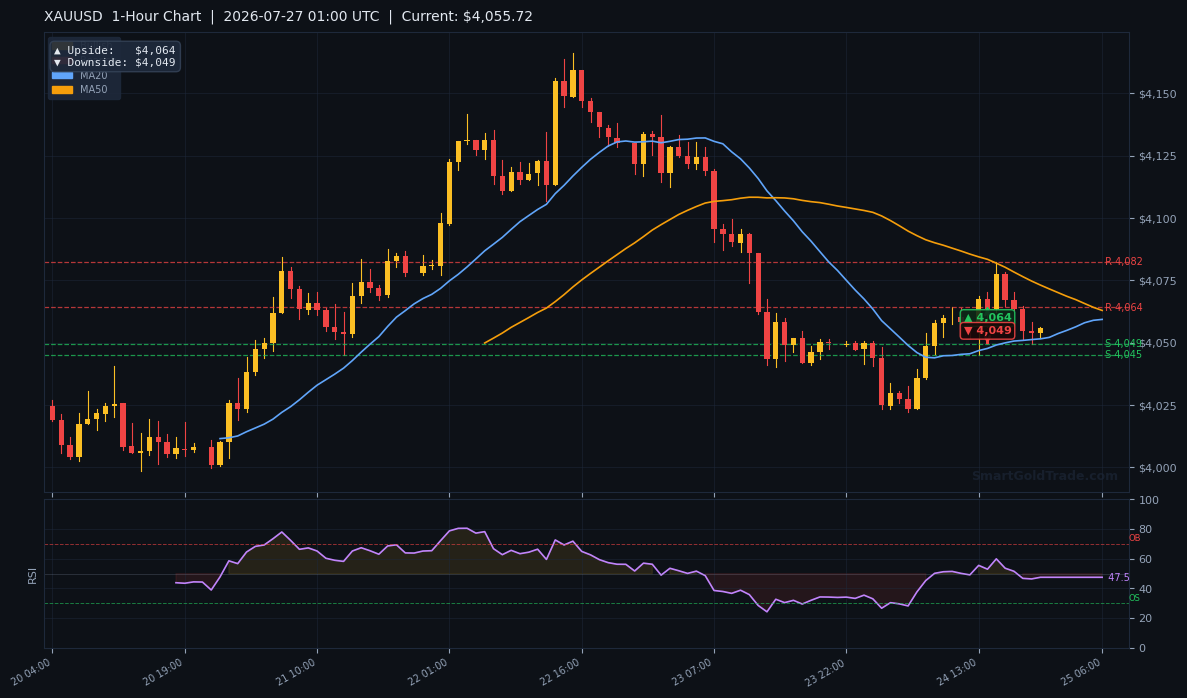
The Asian session typically sees reduced participation from Tokyo and Singapore after the weekend, with Hong Kong books often squaring hedges. We expect the gold price to oscillate between $4,049 and $4,064 — the one-hour pivot range — with an outer band near $4,010–$4,025 marked by the daily ATR envelope. Thin liquidity means stops above $4,064 and below $4,049 can get hunted quickly; don’t position aggressively until London feeds volume. The key trigger today isn’t data — it’s whether the New York closing price from Friday functions as a magnet or a resistance magnet for algorithmic flows.
Technical Analysis
The gold price structure remains decisively bearish on the four-hour chart, but short-covering signals are beginning to flicker around the $4,000 psychological barrier. Let’s break down the moving averages, momentum, and the exact levels that matter right now.
Moving Average Structure
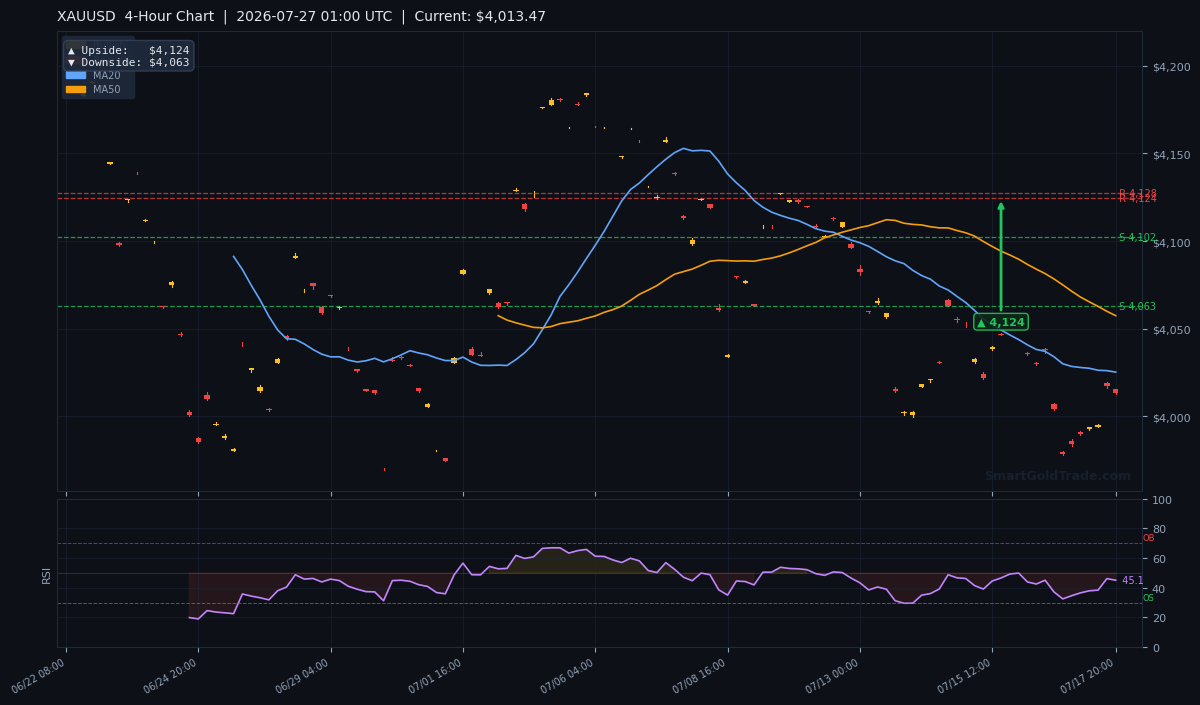
The MA20 reads $4,025.26, the MA50 sits at $4,057.47, and the MA200 stands far above at $4,159.27. With Monday’s open projected near $4,013.47, well below all three, the bearish momentum is intact. The death cross between the shorter-term averages — MA20 below MA50 — confirms that sellers have controlled the tape since mid-July. A sustained recovery above $4,025 (MA20) would be the first tiny crack in that bearish armour.
RSI and Momentum
The 14-period RSI prints at 45.1, a neutral reading that leans slightly bearish but avoids oversold territory. This means the gold price can still grind lower before a genuine mean-reversion signal appears. However, the RSI has formed a subtle double-bottom pattern just below the 40 level, hinting that downside momentum is losing steam and a snap back toward $4,064 is plausible on any bullish catalyst.
Key Price Levels
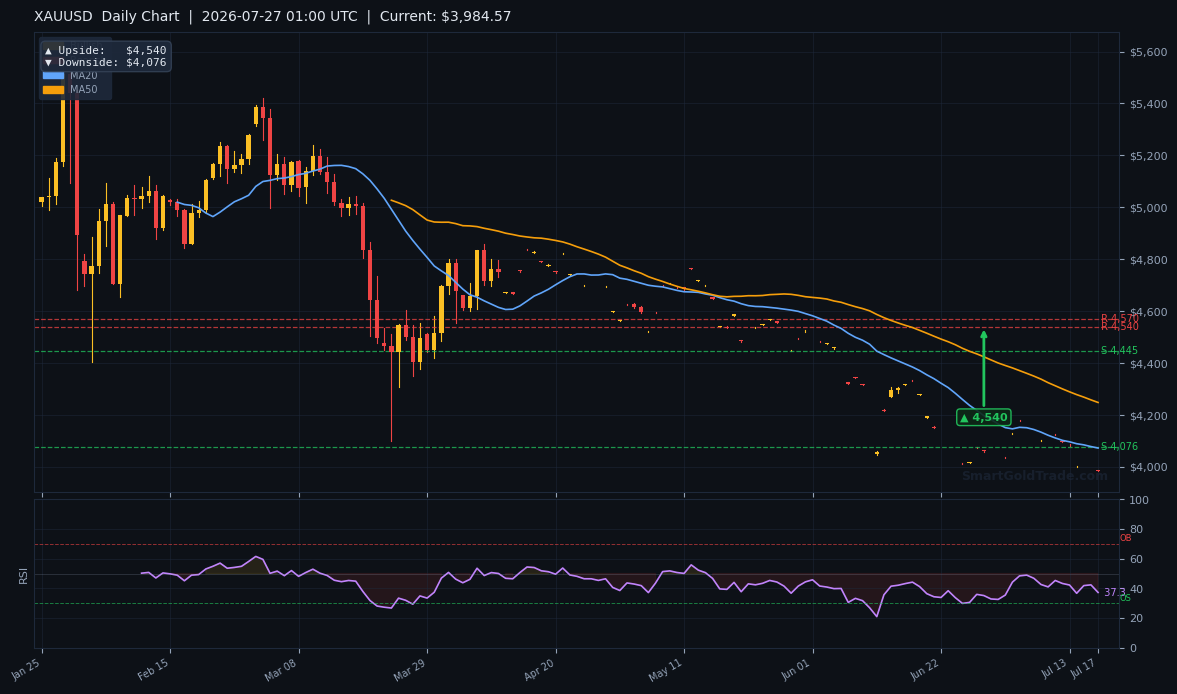
From the provided pivot suite, the immediate brackets are: Support S1 at $4,147.61 and S2 at $4,124.26 (now overhead resistance after last week’s breakdown), while Resistance R1 is $4,164.23 and R2 is $4,159.15. Because the market is trading far below those zones, the more active levels come from the timeframe targets drawn on the charts: 4‑hour downside pivot at $4,063, 1‑hour downside at $4,049, and the heavy daily downside target at $4,076. The ATR(14) of $12.14 suggests a normal session range of roughly $4,001 to $4,025, so any break beyond that band would signal an abnormal volatility event — likely driven by a headline.
| Timeframe | Upside Target | Downside Target |
|---|---|---|
| Daily | $4,540 | $4,076 |
| 4‑Hour | $4,124 | $4,063 |
| 1‑Hour | $4,064 | $4,049 |
These pivot zones frame the day: a bounce from $4,049 targets $4,064 as the first scalp, while a break above $4,064 opens the path to the 4‑hour target of $4,124. Failure below $4,049 would put the $4,000 handle back in focus.
Fundamental Drivers
The single most powerful variable in the pipeline is the FOMC decision on July 29, 2026. With the market already pricing in a hold at 3.75%, the rate decision itself is a non-event. The action will live in the statement’s forward guidance: any mention of “insurance cuts” or “elevated uncertainty” can send the gold price ripping above $4,100, while a reaffirmation of the “higher for longer” mantra could shatter $4,000 support. DXY has a strong negative correlation with gold and will amplify every word from Chair Powell’s press conference.
Key Event to Watch
FOMC Statement – July 29, 14:00 ET. Even though rates stay unchanged, the dot‑plot whisper and tone shifts will dictate the next directional wave. Gold tends to benefit from any dovish tilt; a hawkish hold would trigger a swift test of $3,990–$4,000. Traders should stay flat or hedged ahead of the release unless they are using a tactical pre‑event play like the one we outline below.
Devil’s Advocate
The entire long thesis breaks if the gold price sustains a break below $4,000 with volume. A daily close under that floor would turn the breakdown from last week’s $4,147 support into a confirmed downtrend with no visible floor until the $3,920–$3,940 zone. Simultaneously, a sudden spike in US real yields — perhaps if the Fed statement leaks hawkish rhetoric — would decimate the buy-side argument. The threshold for invalidation is firm: if the price spends more than one hour below $3,995 during any session, the bias shifts to sell-on-rallies toward $3,950.
Trading Strategy for Asian Session
Given the quiet liquidity and near-term oversold structure, a tactical long from the $4,010–$4,015 zone offers a compelling risk-reward profile. Here is the exact plan:
- Entry: $4,010–$4,015 on a pullback into support. On Monday, a dip to $4,013.47 would sit directly inside this window.
- Stop Loss: $3,995 — placed below the critical $4,000 psychological handle and 1.5 × ATR ($18.2) below the mid-entry, ensuring the trade is not stopped out by normal noise.
- Take Profit 1: $4,064 — the 1‑hour upside pivot; partial exit here reduces overnight risk.
- Take Profit 2: $4,124 — the 4‑hour upside target that aligns with former support-turned-resistance.
- Risk/Reward: Approx. 111 points reward vs 18 points risk, a 6:1 ratio even before the first target.
Volume is the wildcard — if Asian turnover stays depressed, the move may be gradual. Traders who prefer to delegate execution can explore professional gold trading signals that provide real‑time entry, stop, and target updates. Alternatively, copy trading lets you automatically mirror top traders without manual execution. For those executing manually, patience is paramount: wait for the price to print inside the $4,010–$4,015 band before engaging.
It’s also worth noting that SmartGoldTrade offers halal gold trading with spot physical ownership and no overnight interest — a crucial advantage for traders holding positions through the FOMC event. In a market where rate differentials can raise swap costs, the interest-free model keeps your costs predictable even during volatile carry periods.
Key Takeaways
- The gold price near $4,013 trades below all three key moving averages, confirming a bearish structure — but the RSI at 45.1 leaves room for a corrective bounce.
- Immediate upside hurdles are the 1‑hour pivot at $4,064 and the 4‑hour pivot at $4,124; former supports at $4,147–$4,164 now act as heavy resistance.
- The ATR(14) of $12.14 projects a normal Asian range of $4,001–$4,025, making $3,995 a logical stop loss for a long.
- With no tier-one data today, the gold price will be driven by order-flow skirmishes; the real catalyst arrives on July 29 with the FOMC statement.
- A break below $4,000 invalidates the long setup and turns the outlook bearish toward $3,920, while a close above $4,064 confirms momentum shift.
- The long entry at $4,010–$4,015 with a stop at $3,995 and targets at $4,064 and $4,124 offers a 6:1 reward-to-risk profile.
Conclusion
The gold price near $4,013 is threading a needle between Friday’s breakdown and Wednesday’s FOMC catalyst. The bearish moving-average alignment is clear, but the thin Asian session often rewards counter-trend scalps when risk is tightly defined. By waiting for a dip into the $4,010–$4,015 entry band and protecting the position below $4,000, you align with a high-probability bounce that could reach $4,064 and eventually $4,124. This is not a call for a long-term reversal — it’s a calculated, low-volume play that respects the broader downtrend while exploiting short-term exhaustion. Stay nimble, honour your stop, and let the Fed do the heavy lifting later in the week.
FAQ
What is the most important support level for gold today?
The 1-hour downside pivot at $4,049 and the psychological $4,000 handle are critical. A daily close below $4,000 would invalidate short-term bullish plays and shift focus toward $3,920–$3,940.
How will the FOMC decision affect the gold price?
The July 29 FOMC statement is the biggest catalyst this week. A dovish tilt — hinting at possible cuts — could push the gold price above $4,100. A hawkish hold, however, may trigger a swift drop toward $4,000 and lower. Staying flat ahead of the release is a conservative approach.
Is gold still in a bearish trend?
Yes. The gold price remains below all key moving averages, and the death cross between the MA20 and MA50 confirms selling pressure. However, a corrective bounce to $4,064 is likely before any further downside.