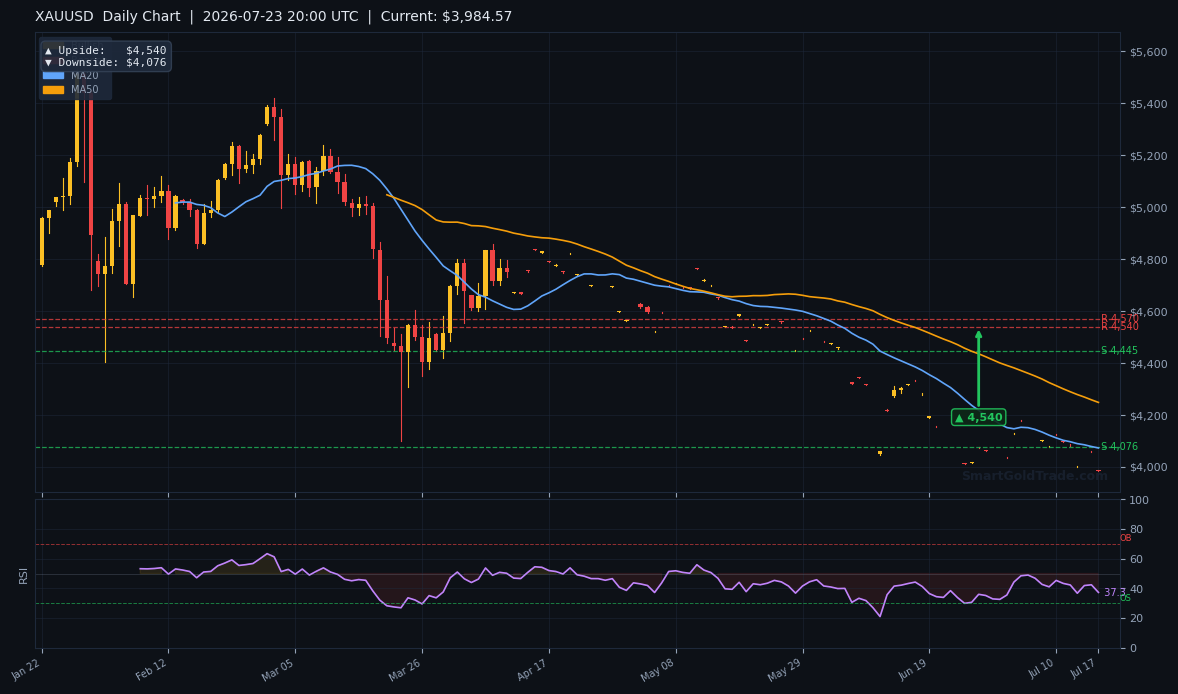
Gold price slides to $4,013.47 intraday as the American session kicks into gear, surrendering a brief early‑morning rally. A disappointing jobless claims figure lifted the gold price to $4,050 earlier, but sellers quickly reasserted control. As of 20:29 UTC, XAU/USD trades at $4,050.34 per troy ounce, recovering from the session low and underscoring the tug‑of‑war between bears and bargain hunters.
The move confirms that even a modest data miss cannot shift the short‑term bearish grip while the dollar and yields remain sticky. With the New York desks now fully online, traders are positioning for a retest of the $4,063 4‑hour pivot — a level that has capped selling pressure twice this week. A sustained break below that floor would open a path toward the daily downside target at $4,076.
Gold Price Market Overview
Macro Context
The U.S. Dollar Index is holding firm near 103.5, refusing to give ground after last week’s better‑than‑expected retail sales data underscored consumer resilience. The 10‑year Treasury yield sits at 4.25%, keeping the opportunity cost of holding non‑yielding bullion elevated. Markets are pricing a shallow Fed easing cycle — at most one 25‑basis‑point cut before year‑end — which leaves the gold price without the dovish tailwind it craves. Geopolitically, tensions in Eastern Europe simmer but have not flared enough to spark a safe‑haven bid strong enough to override the rate‑driven headwinds, and the gold price has not benefited because the dollar is hoovering up haven flows.
Session Outlook
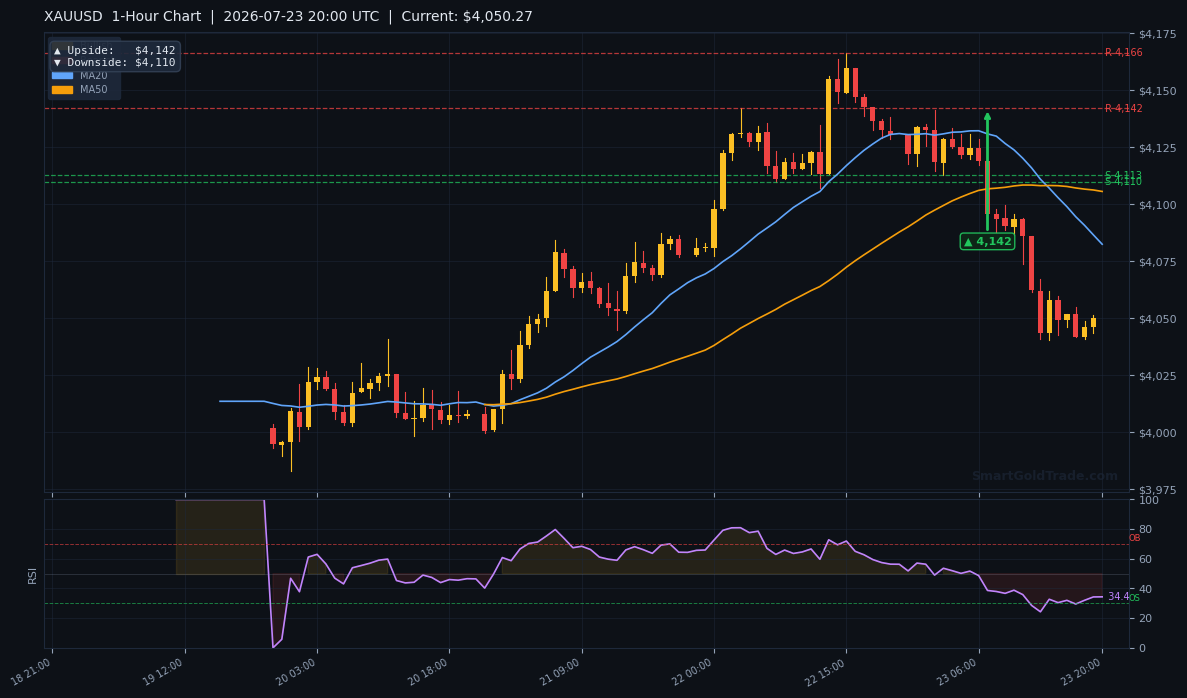
The American session typically brings thicker liquidity and more directional conviction. With New York traders now absorbing the jobless claims print, the initial kneejerk to $4,050 has already been faded, placing the focus squarely on the $4,063 support zone. If that level gives way, stops will trip and the gold price could cascade toward $4,076 — the daily downside projection. A bounce back above the 20‑hour moving average near $4,025 would, however, trap late shorts and set the stage for a squeeze toward the 1‑hour pivot at $4,142.
Technical Analysis
Moving Average Structure
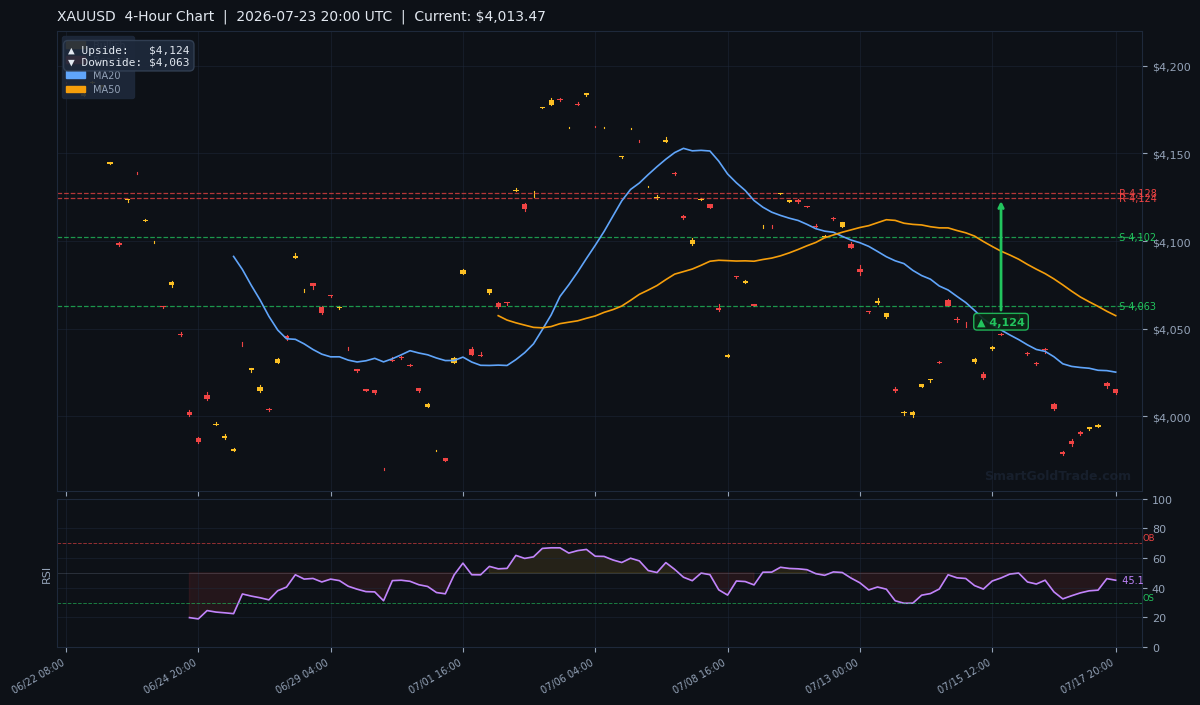
Gold price is trading firmly below all three key moving averages on the 4‑hour chart. The MA20 at $4,025.26 acts as immediate resistance, while the MA50 at $4,057.47 and the MA200 at $4,159.27 loom far overhead, confirming a bearish alignment where shorter‑term averages sit beneath longer‑term ones. This “bear flag” structure on the daily chart reinforces that rallies are selling opportunities until price reclaims the MA50.
RSI and Momentum
The 14‑period RSI sits at 45.1, squarely in neutral territory but tilted toward the lower half. It’s not yet oversold, meaning there’s room for further depreciation before bargain hunters step in. The RSI divergence that appeared last Friday has been worked off, so no reversal signal is imminent — momentum remains with the bears.
Key Price Levels
Immediate support rests at S2 $4,124.26 (now resistance after the breakdown) and S1 $4,147.61. Below that, the 4‑hour pivot at $4,063 and the daily downside target at $4,076 form a critical demand zone. Resistance starts at R1 $4,164.23 and stretches to R2 $4,159.15. The ATR(14) of $12.14 suggests a typical daily range of roughly $4,001 to $4,026, so intraday volatility will remain contained unless news breaks.
| Timeframe | Upside Target | Downside Target |
|---|---|---|
| Daily | $4,540 | $4,076 |
| 4‑Hour | $4,124 | $4,063 |
| 1‑Hour | $4,142 | $4,110 |
Fundamental Drivers
This morning’s jobless claims failed to ignite a lasting bid. The 240K print was mildly disappointing but still historically low, reinforcing the message that the labour market is cooling at a glacial pace. The pound‑yen cross breaking a multi‑week support trendline hints at a broader risk‑off mood, yet the gold price has not benefited because the dollar is hoovering up haven flows. With DXY staying north of 103 and the 10‑year yield refusing to break below 4.20%, the macro equation remains unfriendly for the gold price and other zero‑yield assets.
Key Event to Watch
On Friday July 24, the U.S. Durable Goods Orders for June will be the next volatility trigger. A strong headline reading above the 0.5% consensus could push yields even higher and force the gold price below $4,063. Conversely, a miss — particularly in core orders — would revive talk of a soft patch and potentially spark a short‑covering rally toward $4,124. Traders should position accordingly before the 8:30 AM ET release.
Long-Term Gold Price Trends and Halal Hedging
While short‑term swings in the gold price capture daily headlines, long‑term investors focus on structural drivers that have consistently propelled bullion higher. Central bank gold purchases have surged over the past decade, with many nations diversifying reserves away from the dollar. This institutional demand provides a solid floor under the gold price, even when interest rates rise.
For Muslim investors, owning physical gold aligns perfectly with Shariah principles of holding tangible, riba‑free assets. SmartGoldTrade’s physical gold store offers certified 22K coins and 24K bars, giving you full ownership without leverage or interest. Whether you’re hedging against currency devaluation or building long‑term wealth, allocating a portion of your portfolio to physical gold can reduce overall volatility and preserve purchasing power.
Traders who want to complement physical holdings with active trading can benefit from precise market timing. Professional gold trading signals deliver real‑time entry, stop‑loss, and take‑profit alerts, helping you navigate intraday gold price movements with data‑backed analysis.
Devil’s Advocate
The bearish bias collapses if gold manages to reclaim and hold above the $4,025 MA20 on a 4‑hour closing basis. A move through $4,035 would open the door to a rapid squeeze toward the 4‑hour upside target at $4,124, forcing momentum algos to flip long. The scenario that could trigger such a reversal is a sudden dovish shift in Fed speak or a geopolitical shock that sends DXY tumbling. Absent that, the path of least resistance remains lower.
Trading Strategy for American Session
For aggressive shorts, near‑term entry around $4,013–$4,015 offers a 2.3:1 reward‑risk profile. Place a stop‑loss at $4,035, just above the MA20 and yesterday’s value area high, giving room for the ATR‑sized wicks. First take‑profit sits at the $4,063 4‑hour pivot; scale out half the position there and let the remainder run to the daily downside target at $4,076. If price instead pushes above $4,025, hold fire until a confirmed break of $4,035 flips the intraday bias. For traders looking to take advantage of interest‑free exposure, our Shariah‑compliant spot gold trading platform offers zero swap positions that align with the physical ownership model.
Key Takeaways
- Gold price trades at $4,013.47, below all three major moving averages — the MA20, MA50 and MA200.
- RSI at 45.1 leaves room for further downside; no oversold signal yet.
- Immediate support is the $4,063 4‑hour pivot; a break exposes the daily target at $4,076.
- Resistance stands at $4,025 (MA20) and $4,124 (4‑hour upside pivot).
- Friday’s Durable Goods Orders are the next major catalyst — a beat could sink the gold price beneath $4,063.
- The bearish structure remains intact unless a 4‑hour close above $4,035 happens.
Conclusion
The gold price remains in a reactive, bearish posture as the American session matures. The inability to hold the pop above $4,050 after jobless claims signals that sellers control the tape. All eyes now rest on the $4,063 support; a decisive break would set up a fast move to $4,076 and possibly test the lower end of the daily range. Upside recovery requires a drive through $4,025 and $4,035 — levels that the bears are defending aggressively. Stay nimble, follow the hard data, and let price action confirm before committing size.
FAQ
What is the current gold price?
As of 20:29 UTC on July 23, 2026, the gold price stands at $4,050.34 per troy ounce, rebounding from an earlier low of $4,013.47 during the American session.
What are the key support levels for the gold price right now?
Immediate support sits at $4,063 (4‑hour pivot), followed by $4,076 (daily downside target). A breakdown below $4,063 could accelerate selling pressure.
What resistance must bulls overcome to change the gold price trend?
Bulls need to reclaim the MA20 at $4,025.26 and then close above $4,035 on the 4‑hour chart. The next major hurdle is the 4‑hour upside pivot at $4,124.
Trading Gold (XAU/USD) carries significant risk of loss and is not suitable for all investors. This content is for informational purposes only and does not constitute financial advice. Always conduct your own research and trade responsibly.