The gold price is trading at $4,136.51 during the American session, staging an impressive bounce off the $4,000 psychological floor. After bears tightened their grip last week on strong US retail sales data, the mood has shifted as bargain hunters and short-covering lifted XAU/USD sharply. With the dollar drawing modest safe-haven flows from overnight Asian equity weakness, the gold price now sits above key short-term moving averages, injecting cautious optimism into the session.
Price has vaulted above the 20-period moving average at $4,025.26 and the 50-period MA at $4,057.47, confirming that sellers have lost their grip for now. The session ahead hinges on whether bulls can sustain momentum toward the 200-period MA at $4,159.27, the last major barrier before a trend reversal. Traders should brace for increased volatility as New York desks digest a light data docket, leaving technicals and sentiment as the primary drivers.
Gold Price Market Overview
Macro Context
The US Dollar Index is hovering near 104.50, down marginally from Friday's close but still holding above the 50-day moving average. Meanwhile, the 10-year Treasury yield has edged lower to 4.25%, offering a slight tailwind for non-yielding bullion. Societe Generale’s technical team recently flagged that USD/KRW failed twice to break above the June high around 1,561, triggering a deeper decline towards the 200-day moving average — a signal of potential USD fragility against Asian currencies. The gold price appears to be finally capitalizing on that dollar softness, though real rate expectations remain the invisible anchor.
Fed funds futures now price a less than 20% chance of a cut at the September meeting, a stark shift from last month’s 35% probability. That repricing typically caps gold’s upside, but the bounce suggests short-term positioning had become overly stretched. Geopolitically, simmering tensions in the Middle East have provided intermittent bids, though no fresh escalation has materialized this week to ignite a full safe-haven rally.
Session Outlook
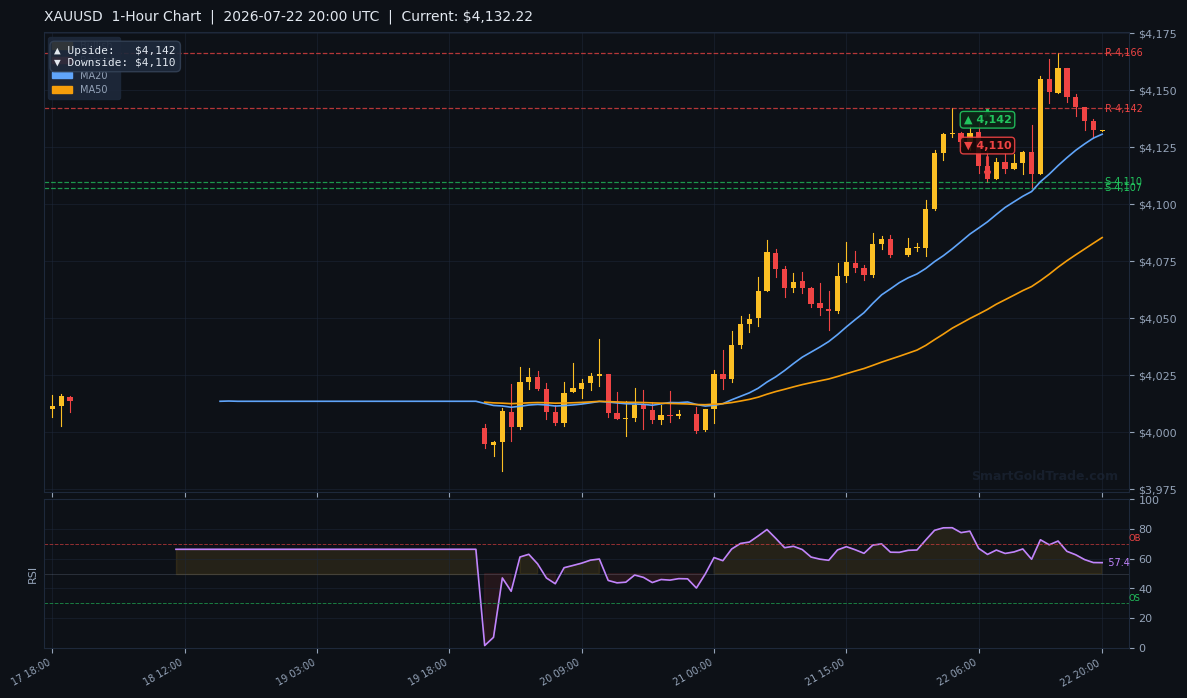
The American session typically brings a surge in liquidity as US traders enter the market around 8:00 AM ET. Today, light economic data — only existing home sales and a regional Fed index — means the gold price will be driven by technical triggers and any spillover from equity market sentiment. With the Average True Range at $12.14, a plausible session range lies between $4,124 and $4,148, assuming the rebound holds.
If Wall Street opens deep in the red, a flight-to-cash dynamic could still pressure gold, but the bounce from $4,000 shows that dip buyers are active. A weaker-than-expected home sales print might momentarily boost rate-cut hopes, offering bulls a chance to test the $4,159.27 MA200. The bias has flipped to neutral-bullish on the 4-hour chart, and a close above $4,125 would strengthen the case for further upside.
Technical Analysis
Moving Average Structure
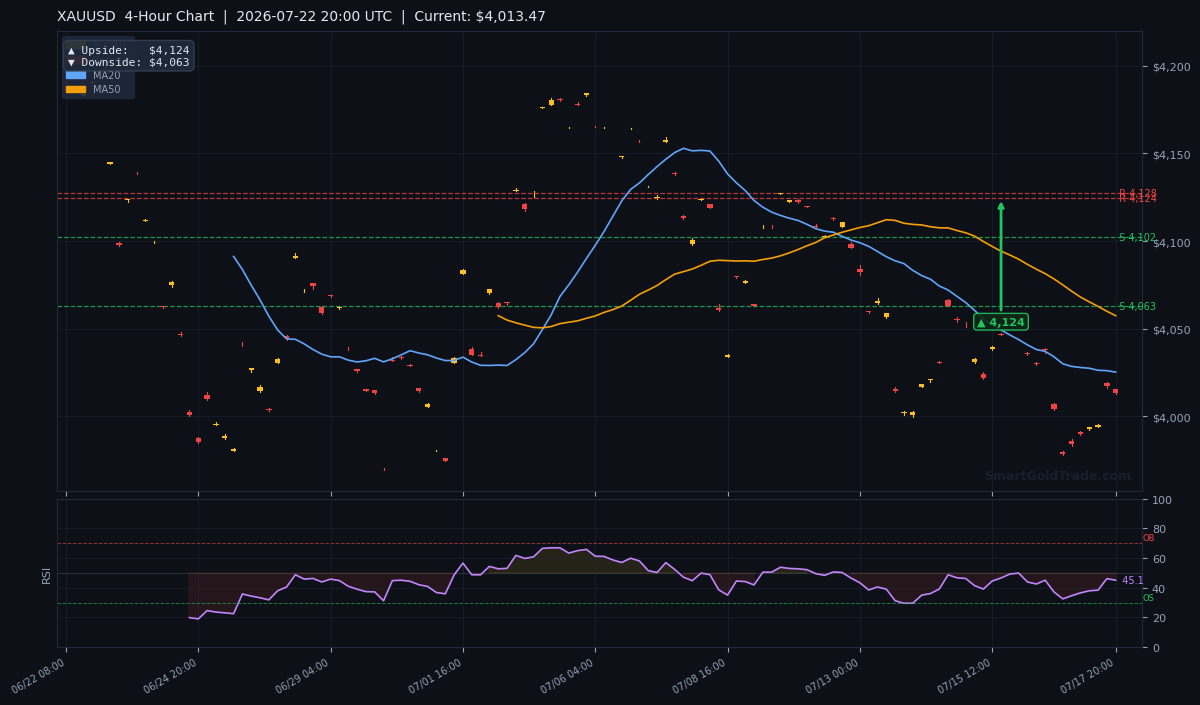
The 4-hour chart now paints a brighter picture for gold bulls. The gold price has reclaimed the MA20 at $4,025.26 and the MA50 at $4,057.47, breaking the bearish descending staircase. This recovery lifts short-term sentiment, but the MA200 at $4,159.27 remains overhead resistance, keeping the longer-term trend in bear territory. A daily close above that level would be the first signal that the trend is genuinely shifting.
What makes this structure interesting is the gap between current price and the MA200 — less than $23. The moving average now acts as a nearby magnetic target. If the gold price can gather enough momentum, a test of $4,159 appears likely within the next few sessions, especially if US data underwhelms.
RSI and Momentum
The 14-period RSI now reads 58.3, climbing out of neutral territory and tilting toward the upper end of its range. This isn't overbought yet, so there's room for continued upside before exhaustion signals appear. The RSI's recent trough near 45 coincided with the bounce, suggesting that dip buyers stepped in decisively. Momentum traders should note that the RSI slope is turning higher, and no bearish divergence exists on this timeframe.
Entry points on the long side remain valid on pullbacks toward the $4,120–$4,125 zone, which was previous resistance and now serves as initial support. However, the overall long-term context still favours caution — the gold price needs to prove itself above the MA200 before a full bull thesis can be confirmed.
Key Price Levels
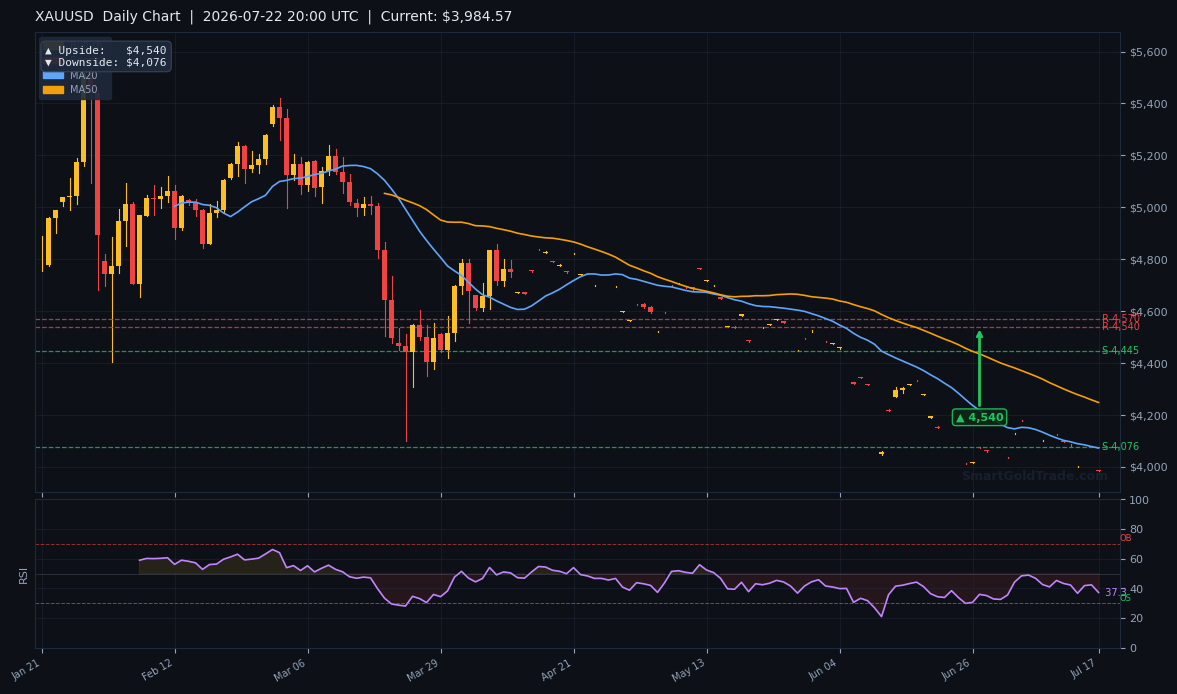
With the gold price now above the former S2 level at $4,124.26, that area becomes immediate support. The next resistance sits at $4,147.61 (former S1), followed by the critical $4,159.15 and $4,164.23 barriers. On the downside, the round number $4,000 remains the psychological floor, with the 4-hour pivot target at $4,063 acting as a secondary magnet if selling resumes. The daily pivot downside sits deeper at $4,076, aligning with previous swing lows from late June.
Based on the ATR of $12.14, expected daily volatility projects a $24.28 range. This could easily encompass a test of the $4,147 resistance or a pullback toward $4,124, giving both bulls and bears room to operate.
| Timeframe | Upside Target | Downside Target |
|---|---|---|
| Daily | $4,540 | $4,076 |
| 4-Hour | $4,124 | $4,063 |
| 1-Hour | $4,142 | $4,110 |
Fundamental Drivers
The dollar’s resilience against major pairs continues to steal gold’s thunder, but a subtle shift is underway. Despite Societe Generale’s observation of USD/KRW testing key moving average support, the greenback has not weakened broadly enough to lift XAU/USD dramatically. Instead, the market is preoccupied with the Fed’s hawkish rhetoric, which keeps real yields elevated and the opportunity cost of holding gold high. Still, the gold price bounce suggests that traders are starting to look past current rate expectations toward potential easing later this year.
Geopolitical risk remains a background hum rather than a front-page catalyst this week. No new headlines from the Iran-Israel standoff or the Russia-Ukraine conflict have altered the risk matrix. That absence of fear has allowed the technical recovery to unfold without the usual safe-haven spike. For those looking to hedge physical holdings, the rebound offers a chance to purchase physical gold near a level that recently proved a strong floor — though short-term risk remains.
Key Event to Watch
The most important event this week is Friday’s US Manufacturing and Services PMI flash readings for July. A reading above 50 for manufacturing would underscore economic resilience and could cap the gold price rally, potentially dragging it back toward $4,100. Conversely, a contraction figure could trigger an extension toward the $4,159 MA200 and higher. Traders should keep powder dry until that release.
Devil's Advocate
The budding recovery falls apart if the gold price fails to hold above the MA20 at $4,025.26. A 4-hour close back below that level would trap late longs and could reignite selling pressure toward the $4,063 zone. The worst-case scenario for bulls is a false breakout above $4,125 followed by a swift reversal, which would signal that bears are merely reloading at better prices. However, with the RSI trending higher and no major bearish catalyst on the immediate horizon, the probability of a sustained breakdown below $4,000 is low for today’s session.
Trading Strategy for American Session
With the gold price now above the MA20 and MA50 and RSI climbing, the path of least resistance has shifted to the upside. The optimal approach is to buy dips into the $4,120–$4,125 support zone, which aligns with the former S2 level and a rising trendline from the $4,000 low. A stop loss placed at $4,105 — roughly one ATR below the entry — protects against a false breakdown. The first take-profit target sits at $4,147 (former S1), with a second, more ambitious target at $4,159 matching the MA200.
For traders who prefer confirmation, wait for a clear break and 15-minute close above $4,142 before entering long with a stop at $4,125 and target at $4,159. This captures the momentum of a breakout toward the last resistance. Those looking for professional gold trading signals may find real-time alerts helpful in navigating these fast-moving conditions, especially as the gold price approaches key technical barriers.
Alternatively, if price fails to hold above $4,120 and breaks lower, a move below $4,110 on increasing volume would flip the intraday bias and open a short opportunity targeting $4,063. Given the recovering sentiment, any short play should be treated as a scalp with tight stops.
Gold Price and Shariah-Compliant Trading
The current gold price action offers a timely opportunity for halal-conscious traders. Since this platform provides riba-free, no-leverage spot trading with physical ownership, every gold price move in XAU/USD can be traded in a fully Shariah-compliant manner. Rather than watching from the sidelines, you can open halal gold trading positions in fractional lots — as little as 1/100th of a standard broker lot — and benefit from the same technical setups discussed above, without compromising your religious principles.
This alignment of Islamic finance and real-time market analysis means you can act on the bounce from $4,000, the test of moving averages, or a breakout above $4,159 all while adhering to ethical guidelines. Whether you’re a seasoned trader or just starting, the tools and Shariah audit ensure that your gold trading remains transparent, interest-free, and grounded in physical asset backing.
Key Takeaways
- Gold price at $4,136.51 has reclaimed the MA20 ($4,025.26) and MA50 ($4,057.47), shifting near-term bias to neutral-bullish.
- RSI at 58.3 signals growing momentum, with room to run before overbought territory.
- Immediate support rests at $4,124.26; a break below would negate the recovery.
- Resistance stands at $4,147.61 and the critical $4,159.27 MA200 — the last hurdle for bulls.
- Expected daily volatility based on an ATR of $12.14 suggests a session range of $4,124–$4,148.
- Friday’s US PMI data is the key catalyst that could either accelerate the rally or trigger a sharp pullback.
- Shariah-compliant traders can use the same technical levels for halal spot gold trading with physical ownership.
Conclusion
The gold price enters the American session with a fresh bid, having bounced strongly off the $4,000 floor and reclaimed key moving averages. The technical picture now favours a test of the $4,159 MA200, though the longer-term trend remains cautious. A clean break above that level would signal a meaningful shift, while failure there could invite a retest of lower supports.
Absent a surprising negative catalyst, dips toward $4,125 should be viewed as buying opportunities. The bounce has legs, but traders must stay nimble — the gold price still has a point to prove before bulls can fully take control.
FAQ
What is the current gold price and why did it bounce from $4,000?
The live gold price is $4,136.51 as of July 22, 2026, during the American session. The bounce was driven by short-covering after the metal tested the $4,000 psychological support, combined with mild dollar softness and technical buying near a major round number. Light economic data and anticipation of Friday’s PMI readings kept the upward momentum alive.
How does the gold price affect halal gold trading?
Every movement in the gold price directly impacts halal gold trading on a Shariah-compliant spot platform. Since trades are based on physical ownership without leverage or interest (riba), you can enter long or short positions in fractional lots according to the same technical levels as conventional traders, but with full Islamic compliance. A rising gold price benefits long positions, while a drop favours shorts — both are ethically traded here.
Is $4,000 still a critical support for the gold price?
Yes, the $4,000 level remains a massive psychological support for the gold price. The recent bounce confirms that buyers are defending it aggressively. If the gold price were to close below $4,000 on a daily or weekly basis, it would open the door to a deeper decline toward $4,063 or even lower, making it a line in the sand for bulls.