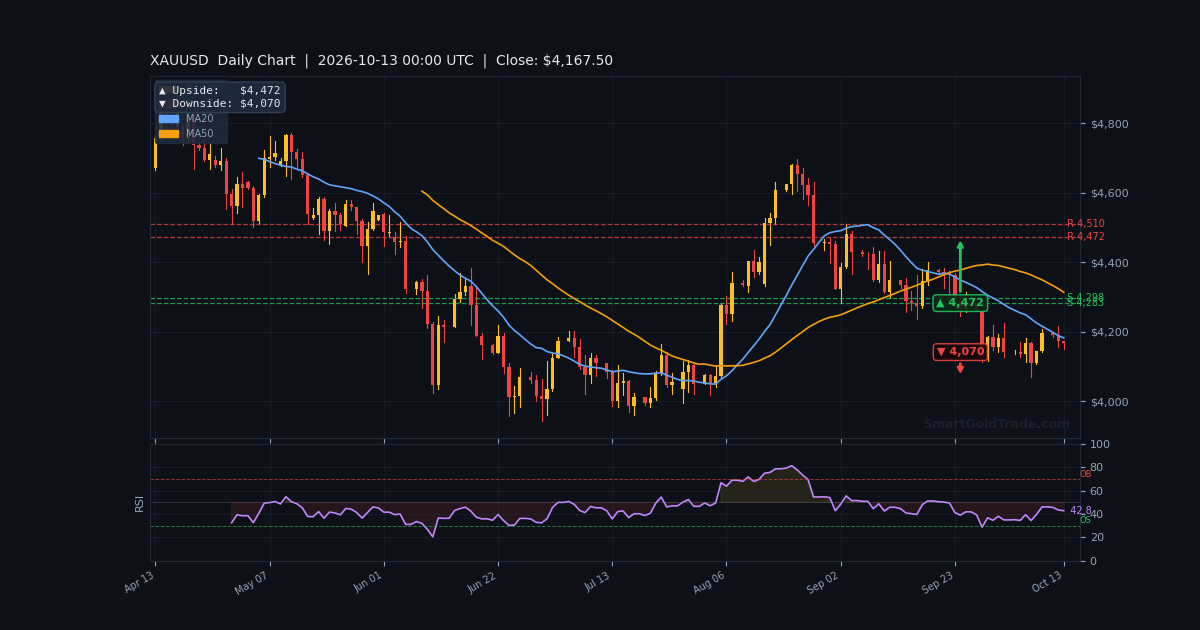
The gold price is holding near $4,181.00 early in Tuesday's Asian session, pinned between a firm US Dollar and thin holiday liquidity. Spot retreated from last week's one-week high above $4,200 after crude oil jumped to a two-week peak on Russia-Ukraine ceasefire headlines and fresh Houthi strikes in Saudi Arabia.
That combination lifted inflation expectations and revived talk of additional Federal Reserve tightening — a mix that traditionally weighs on a non-yielding metal. With US cash markets quiet after Monday's Columbus Day closure, traders are waiting for this week's US inflation data before committing size. The session ahead looks like a setup phase, not a chase phase. Patience over impulse.
Gold Market Overview
Macro Context
The Dollar Index is trading at year-to-date highs near 102.60, its strongest level in roughly 17 months, and is now eyeing the April 2025 cycle high at 103.30. Cleveland Fed President Beth Hammack said overnight that further tightening is needed, though she remains open to adjusting the pace.
Her comments followed a weekend of geopolitical headlines — the announced Russia-Ukraine energy ceasefire and renewed Middle East tension around the Strait of Hormuz. WTI ended Monday up more than 1.60% at $93.17, feeding directly into the inflation narrative that supports higher real rates.
Countering the bearish tilt, gold-backed ETF inflows have reached a four-year high, and China's central bank added 740,000 ounces in September — a 23rd consecutive month of buying. That structural demand is a quiet floor beneath the market.
Session Outlook
Asian liquidity is thin today, with Japan and Singapore desks still working through post-holiday positioning. Expect a contained range between $4,154 and $4,177 unless a headline forces a break.
The ATR of $8.94 — about 0.21% of spot — suggests an hourly range near nine dollars. That is modest, and it argues against chasing either direction. Watch for a reaction at $4,170.91 MA20, which has acted as an intraday magnet.
Technical Analysis
Moving Average Structure
Price at $4,181.00 sits below the MA50 of $4,186.25 but above the MA20 of $4,170.91. That compressed cluster near $4,186 is the immediate ceiling.
On the higher timeframes, the H4 EMA200 sits at $4,254.46 and the D1 EMA200 at $4,300.89, confirming a bearish structural backdrop. Until price reclaims $4,186 on a closing basis, rallies remain corrective.
RSI and Momentum
The RSI(14) is at 53.3, squarely in neutral territory. Stochastic reads 44.1 / 48.2, showing no oversold exhaustion yet. MACD is negative at -4.25 with a histogram of -0.92, meaning downside momentum is present but not accelerating.
ADX at 27.6 confirms a trending environment, though the trend is currently down. There is room for RSI to fall toward 35 before any genuine oversold bounce becomes likely.
Key Price Levels
Immediate support is S1 at $4,154.73, which also matches yesterday's low. Below that, S2 sits at $4,150.18. On the upside, R1 is $4,216.30 and R2 is $4,179.69.
The Bollinger bands span $4,186.48 upper to $4,156.06 lower, with the middle at $4,171.27. Price is hugging the upper half — a classic bullish continuation posture unless $4,154 holds firmly.
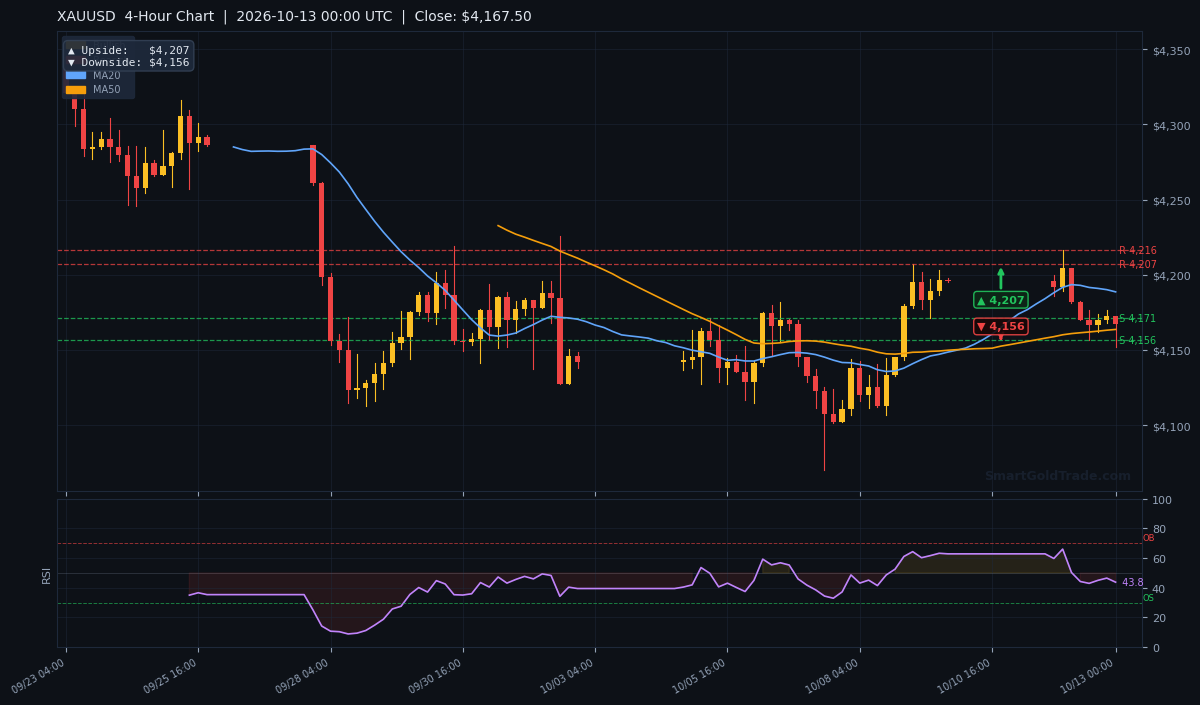
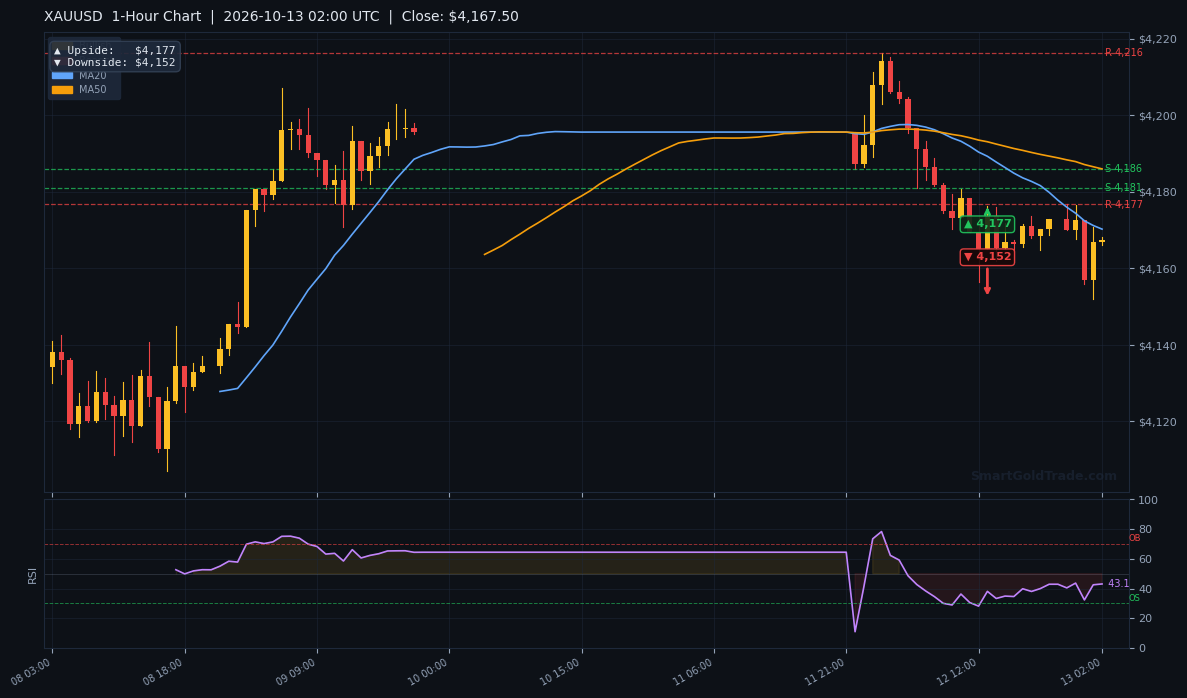
| Timeframe | Upside Target | Downside Target |
|---|---|---|
| Daily | $4,472 | $4,070 |
| 4-Hour | $4,207 | $4,156 |
| 1-Hour | $4,177 | $4,152 |
Fundamental Drivers
The dominant driver overnight was the oil spike. Crude's move to a two-week high on the Russia-Ukraine energy ceasefire headlines and Houthi attacks in Saudi Arabia pushed inflation expectations higher, which in turn strengthened the case for Fed hawkishness.
Hammack's comments reinforced that narrative. She said inflation pressures are spreading beyond AI, and business contacts describe an economy that is "thriving." That language supports higher Treasury yields and a firmer Dollar — both headwinds for gold.
Offsetting this, TD Securities strategists noted that commodity trading advisors are covering shorts across gold and platinum, reducing exposure by roughly 7% of historic max position size. The bank sees geopolitical risk, fiscal concern, and de-dollarization setting up a new bull run into 2027. ETF inflows at four-year highs and China's 23-month buying streak reinforce that longer-term case.
Key Event to Watch
The single most important catalyst this week is the US inflation data due later in the week. A hotter-than-expected print would reinforce the hawkish Fed narrative and pressure gold toward $4,150. A softer number could spark a relief rally toward $4,177. Traders running automated systems may want to consider a news event trading protection tool to pause execution during the release.
Devil's Advocate
The bearish bias has one clear vulnerability: $4,154.73. That level has held twice in the last 24 hours and coincides with yesterday's low. A clean hourly close above $4,171.27 — the Bollinger middle — would flip the short-term structure bullish.
If ETF and central bank demand continues to absorb selling, the market could squeeze higher toward $4,179.69 and then $4,207. The scenario that invalidates the bear case is a softer-than-expected inflation print combined with continued CTA short covering.
Trading Strategy for Asian Session
Given thin liquidity, the disciplined play is to wait for price to reach a defined level rather than chase. A short setup is valid on a rejection from $4,216.30 to $4,186.25, with a stop one ATR above at $4,190 and a first target at $4,154.73.
A second target sits at $4,150.18. That gives a risk-reward near 1:1.5, which is acceptable in a low-volatility session. If price instead reclaims $4,186.25 on a closing basis, flip bias and target $4,216.30 with a stop at $4,170.
Position sizing should reflect the modest ATR of $8.94. Traders building long-term exposure through tangible assets may find value in physical gold products. Those focused on active trading should keep leverage low and stops tight, and avoid holding through the inflation release without a plan.
Key Takeaways
- Gold price at $4,181.00, below the MA50 of $4,186.25 but above the MA20 of $4,170.91.
- RSI at 53.3 is neutral — no oversold signal yet.
- Immediate support at $4,154.73; a break opens $4,150.18.
- Immediate resistance at $4,216.30; a reclaim targets $4,186.25.
- ATR of $8.94 implies a contained session range — do not chase.
- ETF inflows at four-year highs and China's 23-month buying streak remain structural tailwinds.
Conclusion
The gold price is caught between a firm Dollar and resilient physical demand. Near-term structure favors bears while price holds below $4,186, but the downside looks limited unless $4,154.73 gives way decisively.
This week's US inflation data is the pivot. Until then, the Asian session is a preparation window, not an execution window. Define your levels, size conservatively, and let the market come to you. The next directional move will likely be decided by the inflation print, not by today's thin tape.
FAQ
- What is driving the gold price lower today?
- A stronger US Dollar near 102.60, higher oil prices above $93, and hawkish Fed rhetoric from Beth Hammack are the primary pressures. Spot sits at $4,181.00, down 0.23% on the day.
- What are the key support levels for gold right now?
- Immediate support is $4,154.73 (S1 and yesterday's low). Below that, $4,150.18 (S2) is the next floor. A break of both would open the daily downside target at $4,070.
- Where is resistance for the gold price?
- First resistance is $4,216.30 (R1), followed by $4,186.25 (MA50). The 1-hour chart upside target sits at $4,177, and the 4-hour target is $4,207.
- Is now a good time to buy gold?
- With RSI at 53.3 and price below the MA50, the short-term bias is bearish. Long-term buyers may prefer to wait for a test of $4,154.73 or a confirmed reclaim of $4,186.25 before adding exposure.
Risk Disclaimer: Trading Gold (XAU/USD) carries significant risk of loss and is not suitable for all investors. This content is for informational purposes only and does not constitute financial advice. Always conduct your own research and trade responsibly.