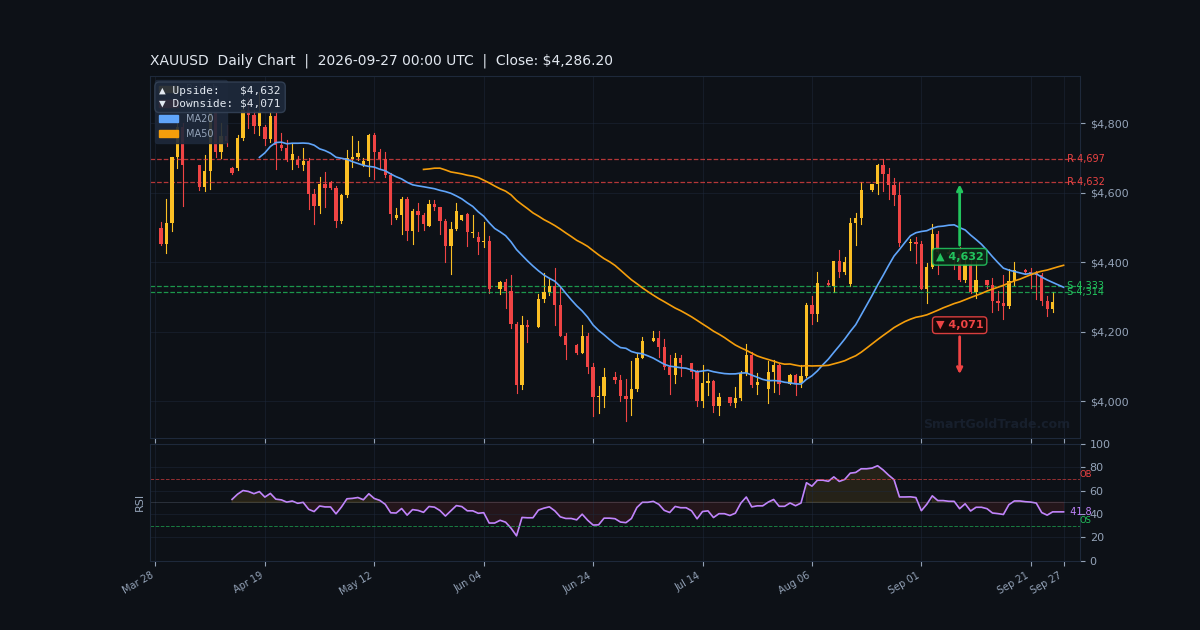
Gold (XAU/USD) is trading at $4,286.20 per troy ounce as of the September 27, 2026 H1 bar, holding a narrow band after a volatile stretch that pushed the metal to its lowest level of 2026. If you're looking for a clear gold price forecast next week, the short answer is this: the market is coiled between $4,256.90 and $4,301.00, and the first clean break from that range will set the tone into October. Last week's theme was simple — rising Treasury yields and a firmer dollar squeezed the upside, even as dip-buyers defended the $4,300 shelf.
This forecast covers the September 27 – October 03 window. We break down last week's price action, the upcoming economic calendar, exact technical levels from the H1 feed, and three trade scenarios with entries, targets, and stops.
Last Week in Review
Price Action Recap
Gold opened last week on a soft footing and never fully recovered its balance. Sellers pressed XAU/USD toward the $4,300 area — described by FXStreet as a "key support area" — and briefly tagged the lowest level of 2026 before buyers stepped in.
Midweek, the metal staged a relief bounce toward $4,400 as Treasury yields retreated, with tmgm noting gold "appreciates to $4,400 as yields retreat." That rally faded into Friday, leaving the market pinned near $4,286 by the close.
The week's structure was a lower-high, lower-low sequence on the daily chart — a bearish continuation pattern — but the failure to break cleanly below $4,256 kept the door open for a stabilization attempt.
Key Events That Moved Gold
Three drivers dominated last week's tape. First, US Treasury yields pushed higher, with the 30-year bond yield hitting a 22-year high — a direct headwind for non-yielding gold. Second, Fed's Hammack said policy still isn't restrictive despite high inflation, reinforcing hawkish rate expectations.
Third, CFTC data showed Gold NC Net Positions at $225.9K versus the previous $230.3K, a modest reduction in speculative length. The combination of higher yields, hawkish Fed rhetoric, and trimming longs explains why XAU/USD struggled to hold rallies above $4,400.
Weekly Close Analysis
Gold closed the week at $4,286.20, sitting directly on the MA20 and MA50 cluster. The weekly candle printed a small-bodied doji-like structure with a modest lower wick — a sign that sellers are losing momentum but haven't surrendered control.
Critically, the close held above S1 at $4,258.10 and below R1 at $4,301.00. That $43 range is now the immediate battlefield for the coming week.
Next Week Economic Calendar & Gold Impact
The week ahead is event-heavy, with US labor data, ISM prints, and Fed commentary all capable of forcing a directional break from the $4,256–$4,301 range. Traders should treat each release as a potential range-expansion trigger.
| Day | Event | Forecast | Previous | Gold Impact |
|---|---|---|---|---|
| Mon Sep 28 | Fed Speakers (multiple) | — | Hawkish | Hawkish tone → bearish; dovish pivot → bullish |
| Tue Sep 29 | US CB Consumer Confidence | — | — | Beat → risk-on, mild bearish; miss → safe-haven bid |
| Wed Sep 30 | US ADP Employment | — | — | Strong → hawkish, bearish gold; weak → dovish, bullish gold |
| Thu Oct 01 | US ISM Manufacturing PMI | — | — | Sub-50 → recession fear, bullish gold; strong print → bearish |
| Fri Oct 02 | US Nonfarm Payrolls | — | — | Hot NFP → hawkish, bearish; miss → dovish, bullish gold |
A hot NFP print would reinforce the hawkish Fed narrative and likely drive XAU/USD toward S2 at $4,256.90, with a break opening the daily downside target at $4,071. A soft print would validate the "policy too tight" argument and could spark a rally toward R1 at $4,301.00 and beyond.
Fed speakers on Monday and Tuesday matter too. Any repeat of Hammack's "policy isn't restrictive" line keeps the pressure on gold. Any hint of a dovish shift would flip the near-term bias.
If you'd rather not sit through every release manually, some traders automate the execution side — for instance by mirroring vetted entries through copy trading so a hot print doesn't catch them offside while they're away from the screen.
Technical Analysis
Moving Average Structure
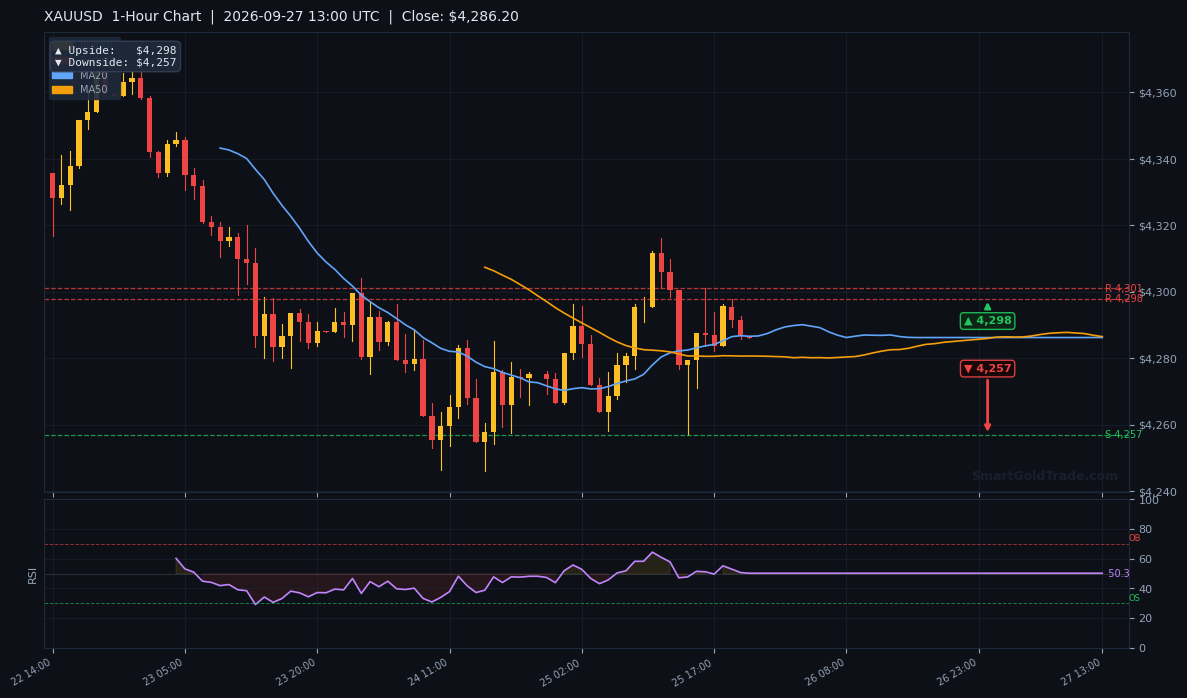
The H1 feed shows MA20 and MA50 both at $4,286.20, with MA20 below MA50 — a bearish alignment. Price is sitting exactly on this cluster, which makes it a decision point rather than a trend confirmation.
A sustained break above the cluster would neutralize the bearish tilt. A rejection here would confirm the MAs as dynamic resistance.
RSI and Momentum
RSI(14) is at 50.2 — dead neutral. There is no overbought or oversold condition to lean on. Momentum is balanced, which means the next directional move will likely be event-driven rather than mean-reversion driven.
In neutral RSI regimes, range trades between S1 and R1 tend to work until a catalyst forces expansion.
Key Support and Resistance Levels
Use these exact levels for entries, stops, and targets this week:
- R2: $4,316.10 — secondary resistance, breakout target
- R1: $4,301.00 — immediate resistance, first hurdle
- Current Price: $4,286.20 — MA20/MA50 cluster
- S1: $4,258.10 — immediate support
- S2: $4,256.90 — critical floor, break opens deeper downside
Chart pivot targets add context:
- 1-Hour: Upside $4,298 | Downside $4,257
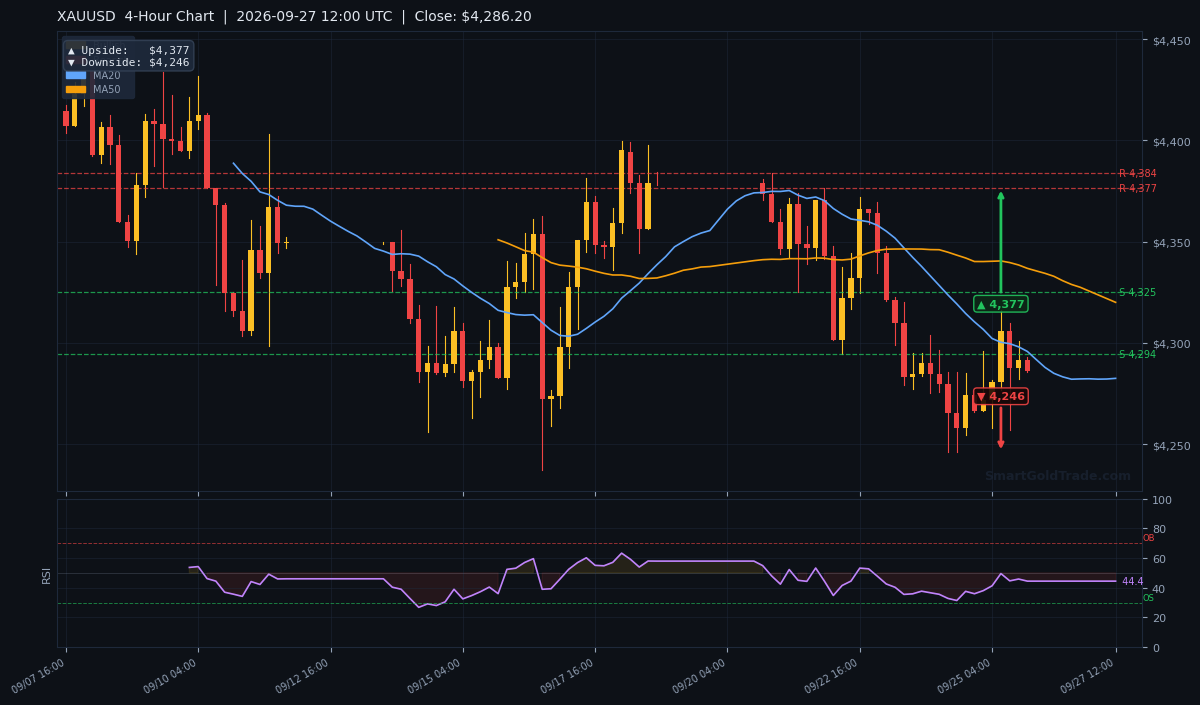
- 4-Hour: Upside $4,377 | Downside $4,246
- Daily: Upside $4,632 | Downside $4,071
The 4-hour downside target at $4,246 sits below S2 and represents the first meaningful extension if $4,256.90 fails. The daily upside target at $4,632 is the larger swing objective if bulls reclaim $4,301 and hold.
For those who prefer to let a system flag these levels automatically, a price action trading system for gold can detect the same candlestick and supply/demand zones discussed here in real time.
Trading Scenarios This Week
Bullish Scenario (probability 35%)
Trigger: A daily close above $4,301.00 (R1) backed by a soft NFP or dovish Fed comment. Entry zone: $4,290–$4,305 on a confirmed breakout. Target: $4,377 (4-hour upside), then $4,632 (daily upside). Stop loss: $4,256 (below S2).
Bearish Scenario (probability 45%)
Trigger: Rejection at $4,301 and a break below $4,256.90 (S2). Entry zone: $4,270–$4,285 on a failed retest. Target: $4,246 (4-hour downside), then $4,071 (daily downside). Stop loss: $4,305 (above R1).
Neutral / Range-Bound Scenario (probability 20%)
If no catalyst forces a break, expect chop between $4,258 and $4,301. Mean-reversion trades — long near S1, short near R1 — with tight stops just outside the range, are the playbook. Avoid chasing mid-range moves.
Risk Factors to Watch
The biggest risk is a hawkish NFP surprise that forces a clean break below $4,256.90 — that would invalidate the range thesis and open $4,246 and $4,071. A second risk is a geopolitical shock that triggers safe-haven demand and pushes gold through $4,301 toward $4,377.
Watch the 30-year Treasury yield: a further push above its 22-year high would keep gold capped. A sharp retreat in yields would flip the bias bullish. The $4,301 level is the line in the sand — above it, bulls regain control; below $4,256.90, bears own the tape.
Key Takeaways
- Gold trades at $4,286.20, pinned to the MA20/MA50 cluster with a bearish alignment.
- RSI at 50.2 is neutral — no overbought or oversold edge.
- Immediate resistance: $4,301.00 (R1); breakout target $4,316.10 (R2).
- Immediate support: $4,258.10 (S1); critical floor $4,256.90 (S2).
- 4-hour downside target $4,246; daily downside target $4,071 if S2 fails.
- 4-hour upside target $4,377; daily upside target $4,632 if R1 is reclaimed.
Conclusion
The weekly bias is cautiously bearish while price holds below $4,301.00. The MA20/MA50 cluster at $4,286.20 is the pivot — bulls need a daily close above it to shift momentum, while bears need a break below $4,256.90 to confirm the next leg lower.
With RSI neutral and a heavy US data slate ahead, this is a week for level-to-level trading rather than trend-following. The $4,256.90–$4,301.00 range defines the battlefield; the first clean break will set the direction into October.
Frequently Asked Questions
- What is the gold price forecast for next week?
- Gold is expected to trade between $4,256.90 support and $4,301.00 resistance, with a bearish tilt while below R1. A break above $4,301 opens $4,377; a break below $4,256.90 opens $4,246.
- What are the key support levels for XAU/USD this week?
- Immediate support sits at $4,258.10 (S1), with the critical floor at $4,256.90 (S2). Below that, the 4-hour downside target is $4,246 and the daily downside target is $4,071.
- What are the key resistance levels for gold next week?
- Immediate resistance is $4,301.00 (R1), followed by $4,316.10 (R2). A sustained break above R1 targets the 4-hour upside at $4,377 and the daily upside at $4,632.
- Is gold bullish or bearish right now?
- Neutral-to-bearish. MA20 sits below MA50 at $4,286.20, and RSI at 50.2 is neutral. The bias flips bullish only on a daily close above $4,301.00.
- What economic events could move gold next week?
- US ADP Employment (Sep 30), ISM Manufacturing PMI (Oct 01), and Nonfarm Payrolls (Oct 02) are the highest-impact events. A hot NFP is bearish for gold toward $4,256.90; a miss is bullish toward $4,301.00.
- Where should I place my stop loss on a gold trade this week?
- For longs, place stops below $4,256 (under S2). For shorts, place stops above $4,305 (above R1). These levels align with the current range boundaries.
Risk Disclaimer: Trading Gold (XAU/USD) carries significant risk of loss and is not suitable for all investors. Prices are volatile and past performance does not guarantee future results. Nothing in this article constitutes financial advice. Always trade with capital you can afford to lose and consult a licensed advisor where appropriate.