The gold price is holding near $4,304.57 this Asian session, but the calm is deceptive. Bears are pressing against the $4,300.80 support level with conviction, and the market is dangerously thin. Last week's core CPI print — which showed a 0.3% rise, the largest in four months — has radically shifted Fed expectations.
Traders now price a 92.4% chance of a 25 basis point rate hike at Wednesday's FOMC meeting. That is up sharply from roughly 67% before the inflation data. The 10-year Treasury yield punched above 5% on Monday for the first time since 2023, and that yield gravity is pulling hard on non-yielding assets.
This session is about preparation, not action. Liquidity is thin, spreads are wider than normal, and the real volatility waits for Wednesday. Here is how to read the board before the Fed speaks.
Gold Market Overview
Macro Context
The US Dollar Index retains a firm bid ahead of the two-day FOMC meeting that begins later today. EUR/USD has fallen for a fourth straight session, and GBP/USD drifts below 1.3500. That dollar strength is a direct headwind for the gold price.
US Treasury yields remain the dominant driver. The 10-year note is flirting with the 5% threshold, and ING strategist Padhraic Garvey noted the benchmark is "looking for an excuse to mark at 5%." When yields rise, gold's lack of yield becomes a liability rather than a safe-haven virtue.
Geopolitical risk from escalating US-Iran tensions offers some offsetting support, but it is not enough to flip the tape. Oil prices remain elevated, feeding the inflation narrative that keeps the Fed hawkish.
Session Outlook
Asian session liquidity is notoriously thin, and today is no exception. Expect choppy, range-bound action between $4,292 and $4,318 unless a headline hits the wires.
The key trigger to watch is any shift in Fed commentary or a surprise geopolitical development. Without a catalyst, the gold price will likely drift and test the patience of momentum traders. Do not chase moves in this environment.
Technical Analysis
Moving Average Structure
The gold price at $4,304.57 sits below the EMA20 at $4,302.92, below the EMA50 at $4,323.86, and well below the EMA200 at $4,381.78. This is a bearish structure. Price is trading beneath all three key moving averages on the H1 chart.
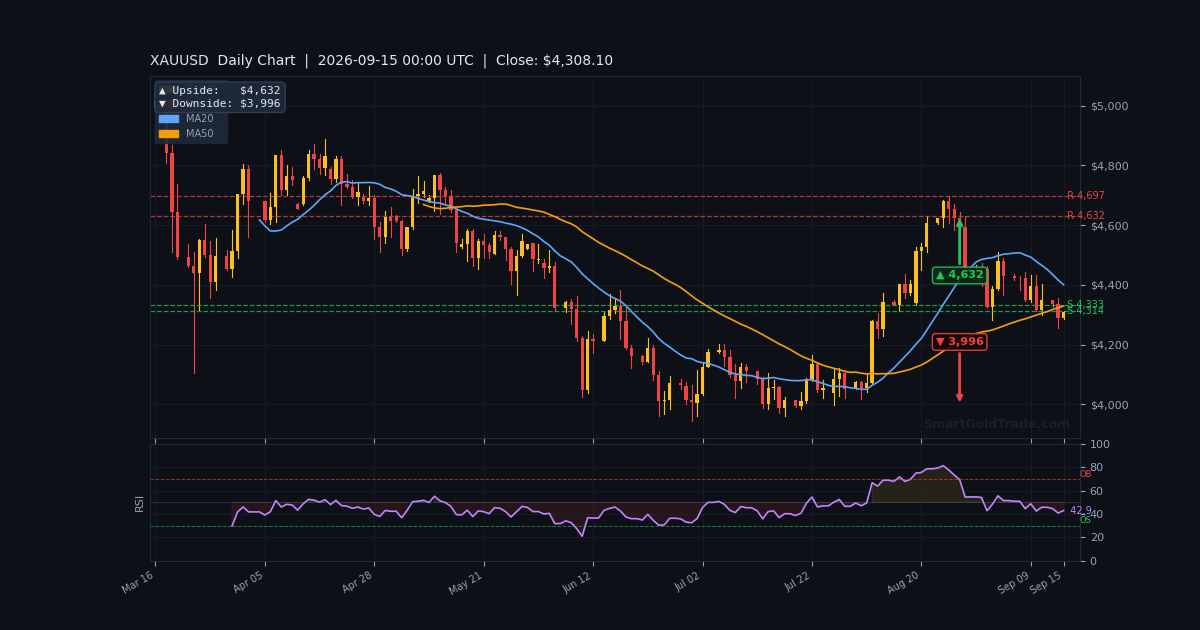
On the higher timeframes, the picture is equally cautious. The H4 EMA200 sits at $4,369.72, and the D1 EMA200 is at $4,319.92. The daily close of $4,304.39 remains below both, confirming the medium-term bearish bias.
RSI and Momentum
The RSI(14) reads 48.7, squarely in neutral territory. This is not oversold, meaning there is room for further downside without triggering a bounce. The Stochastic oscillator shows 65.1/62.2, hinting at fading upward momentum.
The MACD is at -9.50 with a histogram of +2.47. The positive histogram suggests bearish momentum is decelerating, but the negative MACD line confirms the trend remains down. The ADX at 27.6 indicates a strong trend is in place — respect it.
Key Price Levels
Immediate support rests at S1 $4,300.80, with S2 at $4,292.11. A break below S2 opens the door to the weekly low at $4,292.11 and potentially the 4-hour downside target of $4,256.
Resistance begins at R1 $4,317.83, followed by R2 at $4,355.41 — which also marks the prior day's high. The 1-hour upside target sits at $4,339.
The ATR(14) is $18.17, or 0.42% of price. This suggests an expected hourly range of roughly $18. The Bollinger Bands span from $4,330.66 to $4,264.93, with the middle band at $4,297.80. The VWAP sits at $4,295.47, slightly below current price.
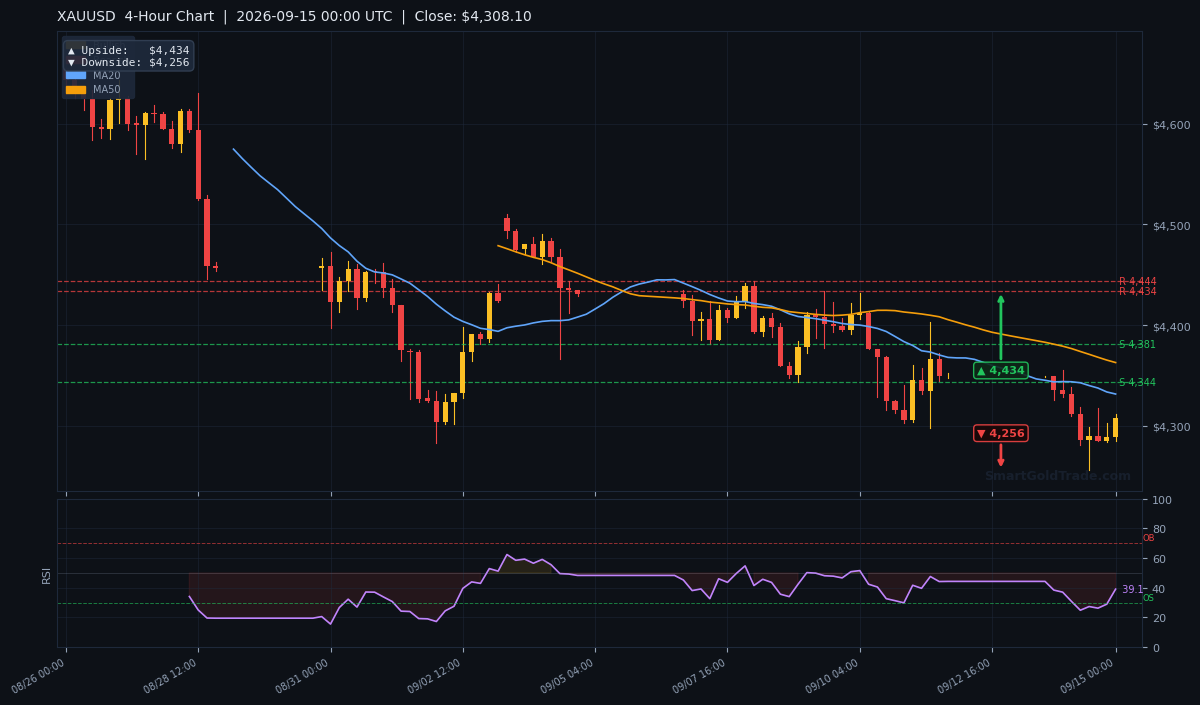
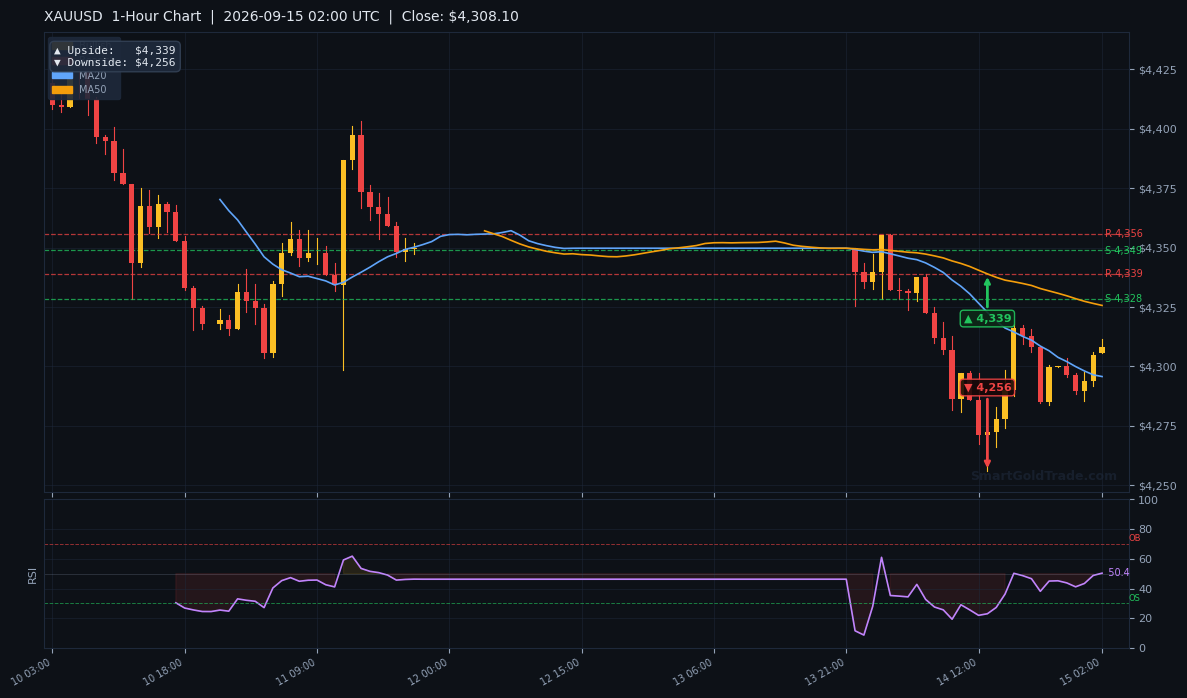
| Timeframe | Upside Target | Downside Target |
|---|---|---|
| Daily | $4,632 | $3,996 |
| 4-Hour | $4,434 | $4,256 |
| 1-Hour | $4,339 | $4,256 |
Fundamental Drivers
Friday's US CPI report showed core inflation rose 0.3% in August, exceeding expectations and marking the largest gain in four months. This single data point reshaped the rate narrative and sent the gold price tumbling below $4,300 in early Asian trade.
The CME FedWatch tool now shows a 92.4% probability of a 25 basis point hike on Wednesday. A week ago, that number was closer to 60%. The market has fully repriced the Fed path, and gold is absorbing the shock.
Rising oil prices add another layer of inflation pressure. Energy costs feed directly into headline CPI, giving the Fed more reason to stay hawkish. For gold, this is a double-edged sword — inflation typically supports gold, but rate hikes to fight it do not.
Key Event to Watch
The FOMC rate decision on Wednesday is the single most important event this week. Fed Chair Kevin Warsh will hold a press conference following the meeting, and any dovish tilt could spark a sharp gold rally.
Conversely, a hawkish tone or a signal of further tightening would likely push the gold price toward the 4-hour downside target of $4,256. Position sizing should reflect this binary risk.
Devil's Advocate
The bearish case is not invincible. If the Fed delivers a hike but signals a pause, or if Warsh strikes a cautious tone on growth, the dollar could retreat sharply. That would flip the gold price back above $4,318 and invalidate the short bias.
A break above R1 at $4,317.83 would be the first warning sign. A sustained move above the EMA50 at $4,323.86 would confirm a shift in momentum and open the path to $4,355.
Geopolitical escalation — particularly around US-Iran tensions — could also trigger safe-haven flows into gold, overriding the yield-driven bearishness. Always respect the possibility of a headline-driven reversal.
Trading Strategy for Asian Session
Given the thin liquidity and the looming FOMC, the prudent approach is patience. Do not chase breakdowns or breakouts in this environment. Wait for clear levels to be tested and rejected.
For a short setup, consider entries near R1 $4,317.83 if price rallies into that zone and shows rejection. Place a stop loss at $4,336, which is roughly one ATR above entry. Target the first take profit at S1 $4,300.80, with a secondary target at S2 $4,292.11.
For a long setup, wait for a clean bounce from S2 $4,292.11 with bullish confirmation. Stop loss at $4,274, targeting $4,318 as the first objective and $4,339 as the second.
Risk-reward should be at least 1:1.5 on any trade. Given the binary FOMC risk, consider reducing position size by half compared to normal. For traders looking to automate entries and exits during volatile sessions, exploring professional gold trading signals can provide structured guidance.
If you prefer a hands-off approach to wealth building in gold, mudarabah investment plans offer a Shariah-compliant route with profit-sharing and no leverage risk.
Key Takeaways
- The gold price at $4,304.57 sits below all key EMAs — EMA20 $4,302.92, EMA50 $4,323.86, EMA200 $4,381.78 — confirming bearish structure.
- Immediate support is $4,300.80, with a break opening the path to $4,292.11 and the 4-hour target of $4,256.
- Resistance at $4,317.83 must be reclaimed for any bullish reversal to gain traction.
- Fed rate hike odds stand at 92.4% for Wednesday's FOMC — a dovish surprise could spark a sharp rally.
- ATR of $18.17 suggests an expected hourly range of roughly $18 — size positions accordingly.
- Thin Asian liquidity means wider spreads and choppy price action — avoid chasing moves.
Conclusion
The gold price is caught between a rock and a hard place. Bearish technicals and a hawkish Fed narrative favor the downside, but geopolitical risk and the possibility of a dovish FOMC surprise keep the bulls alive.
For this Asian session, the bias leans bearish below $4,318, with $4,300 as the key level to watch. A clean break below that support targets $4,292 and potentially $4,256.
However, the real move waits for Wednesday. Until then, preserve capital, avoid overleveraging, and let the levels come to you. The market rewards patience, especially before a major event like the FOMC.
Frequently Asked Questions
- What is the gold price right now?
- The gold price is $4,304.57 as of the H1 bar close at 02:00 UTC on September 15, 2026. It is trading in a tight range during the Asian session.
- What are the key support levels for gold today?
- Immediate support sits at $4,300.80 (S1), followed by $4,292.11 (S2). A break below S2 opens the door to the 4-hour downside target of $4,256.
- What resistance levels should I watch?
- Resistance begins at $4,317.83 (R1), with the next major level at $4,355.41 (R2). The 1-hour upside target is $4,339.
- How will the FOMC meeting affect the gold price?
- Markets price a 92.4% chance of a 25 basis point hike on Wednesday. A hawkish outcome could push gold toward $4,256, while a dovish surprise could rally it above $4,355.
- Is now a good time to trade gold?
- Asian session liquidity is thin, and the FOMC looms. Patience is advised. Wait for clear level tests at $4,300 or $4,318 before committing capital.
Trading Gold (XAU/USD) carries significant risk of loss and is not suitable for all investors. This content is for informational purposes only and does not constitute financial advice. Always conduct your own research and trade responsibly.