Gold price opened the Asian session on July 3, 2026, trading at $4,126.43 per ounce, hovering just below the critical near-term resistance at $4,207.82. Thin liquidity across Tokyo and Singapore markets is keeping price action tight, with the 14-period ATR signaling an expected daily range of about $25.44. Last week’s Japan foreign investment data showed a sharp outflow, reflecting risk-off positioning that has underpinned gold’s safe-haven bid. However, with U.S. markets effectively closing early for the Independence Day long weekend, the session could see exaggerated whipsaws. Traders should watch for a liquidity-driven push toward $4,207, but chasing moves in these conditions often leads to sudden reversals. This analysis examines whether gold can sustain its short-term bullish tilt without falling back to support.
Gold Market Overview
Macro Context
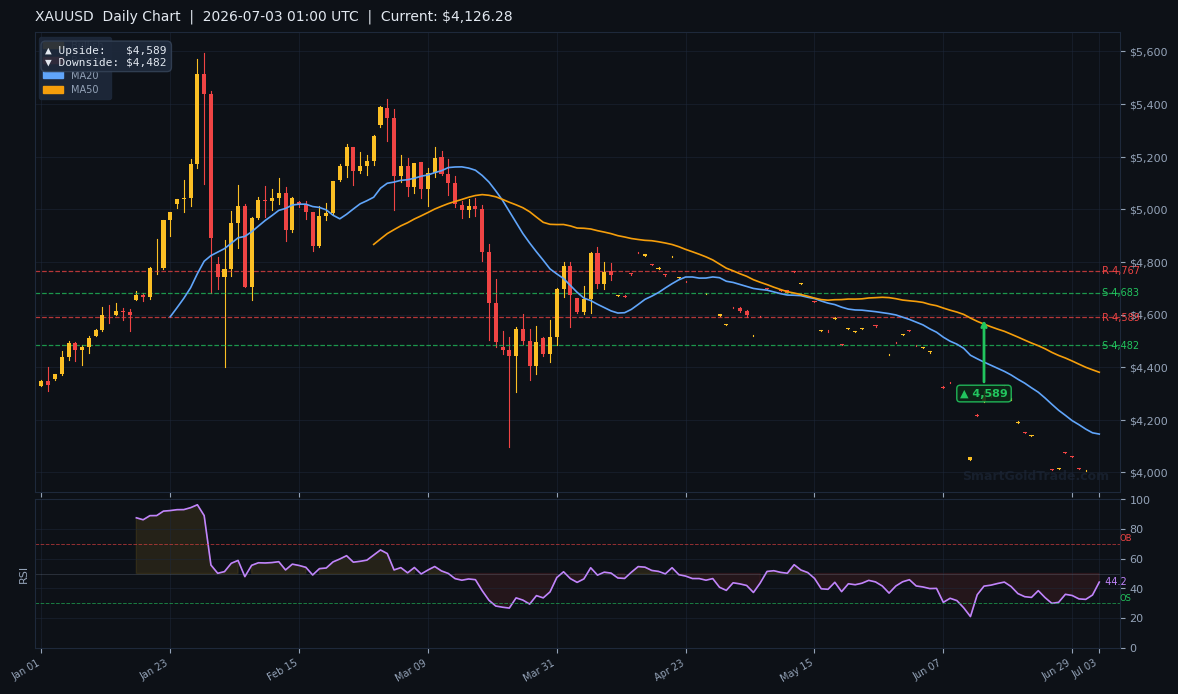
The macro picture remains mixed for gold. The U.S. Dollar Index (DXY) has drifted lower this week, offering a tailwind to dollar-denominated gold. U.S. Treasury yields, however, are holding near recent highs, with the 10-year yield above 4.4%, capping aggressive upside. The Federal Reserve’s last meeting minutes suggested a pause in rate hikes, but the market still prices in a low probability of a cut before year-end. Geopolitical tensions in the Middle East continue to simmer, providing a floor under gold prices. Last week’s Japan foreign bond flows suggested a broad shift away from risk assets, reinforcing gold’s appeal. The widely watched inverse correlation between gold and real yields is holding firm, so any softening in yield pressure could ignite a stronger rally. Against this backdrop, gold price has recovered from the sharp 11% plunge seen in June, but the long-term trend remains bearish as evidenced by the price trading well below the $4,299.63 200-period moving average.
Session Outlook
In the Asian session today, trading volumes are expected to be extremely thin, as most institutional desks reduce activity ahead of the U.S. July 4 holiday weekend. Liquidity pockets around major technical levels like $4,207.82 and $4,182.58 will likely define the range. The absence of tier-one economic data leaves gold price vulnerable to headline-driven spikes, especially from geopolitical news out of Asia. Traders should anticipate a consolidation between $4,182 support and $4,207 resistance, with a potential false breakout in either direction. Patience is paramount — waiting for a confirmed close above or below these levels on the 1-hour chart will save capital from whipsaws.
Technical Analysis
Moving Average Structure
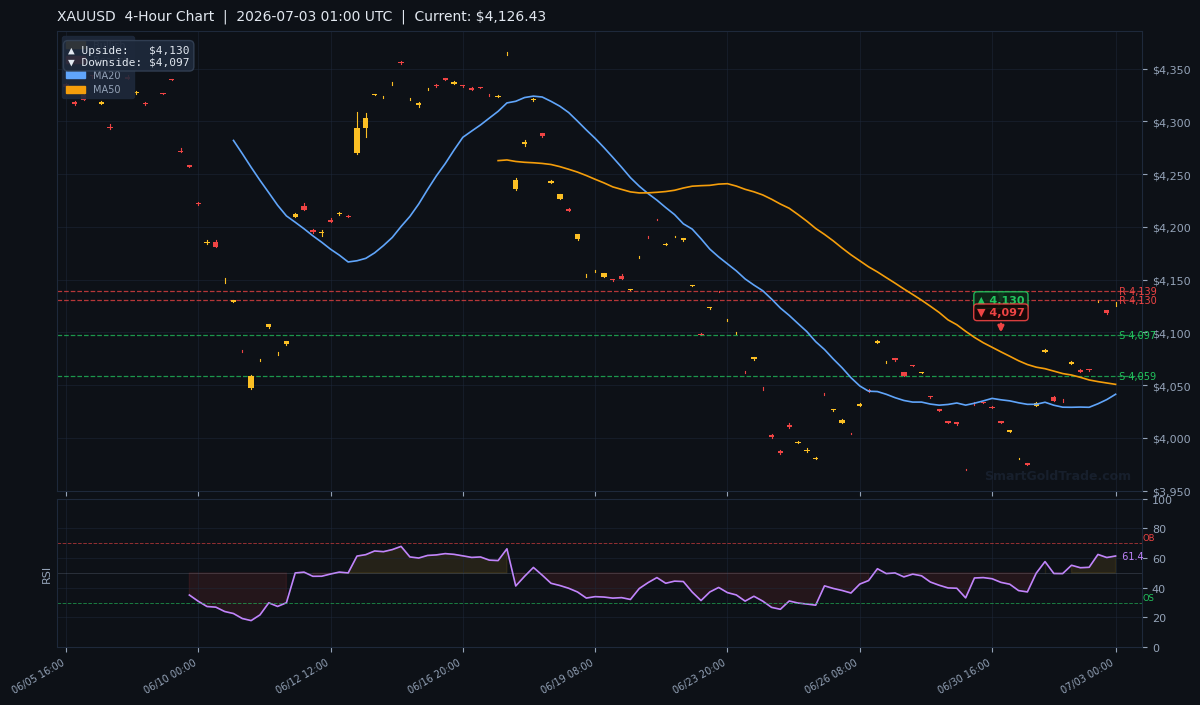
The current moving average setup sends mixed signals. The 20-period simple moving average stands at $4,041.40, with the 50-period MA at $4,050.80. Because the MA20 remains below the MA50, the short-term EMA structure points to SHORT-TERM BEARISH PRESSURE. However, gold price at $4,126.43 is trading firmly above both averages, indicating a near-term bullish breakout from that bearish configuration. This divergence often appears before a directional push — bulls need price to sustain above the MA50 to flip the signal. The 200-period moving average at $4,299.63 looms far above, confirming that the broader trend is still in bear territory. As long as gold remains below the MA200, long-term outlook favors selling into rallies.
RSI and Momentum
The 14-period Relative Strength Index reads 61.4, squarely in neutral territory. This suggests there is room for further upside before entering overbought conditions, typically above 70. The RSI has nudged higher from the mid-50s over the past few days, mirroring the gradual price climb. For intraday traders, the neutral RSI means pullbacks to short-term support zones can be bought without immediate mean-reversion risk, but the lack of overbought conviction also warns that a sudden spike to $4,207 could quickly fade if not backed by volume.
Key Price Levels
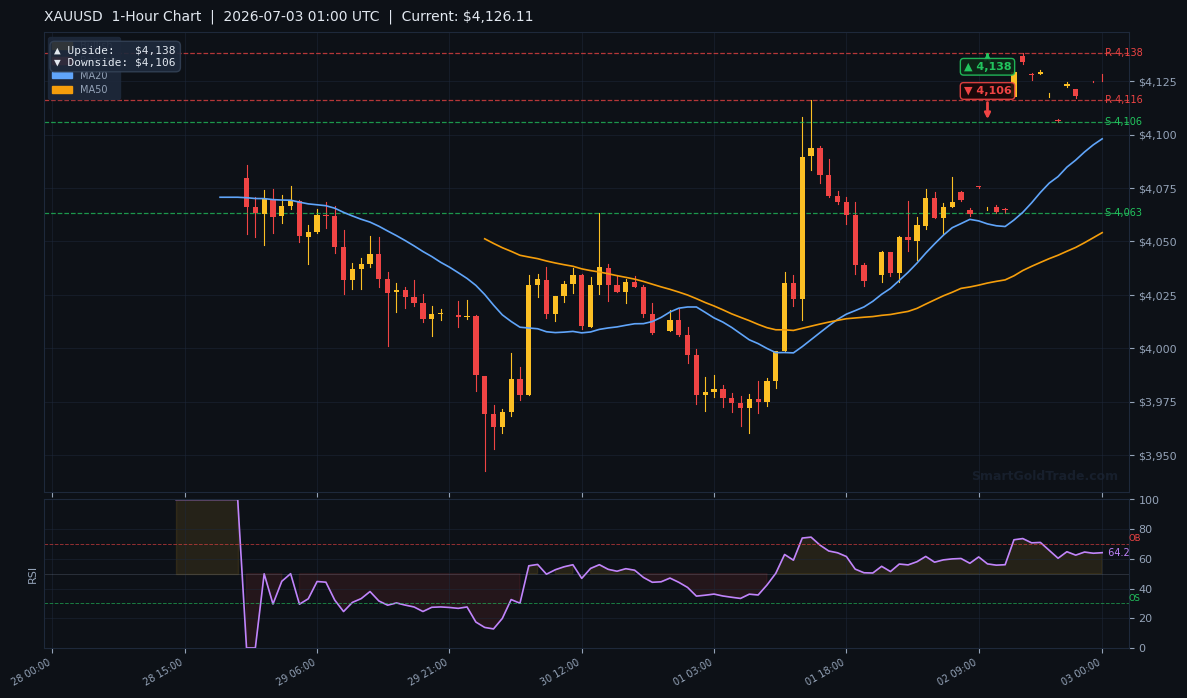
The calculated support and resistance levels using ATR projections give clear boundaries. Immediate support rests at $4,182.58 (S1), with a deeper floor at $4,139.90 (S2). On the upside, resistance R1 is $4,207.82, while R2 sits at $4,139.37, which may reflect a data discrepancy but practically represents a level below current price — traders should treat the $4,207.82 zone as the primary ceiling. The daily ATR(14) of $25.44 suggests an expected range of roughly $4,101 to $4,151, but in thin Asian conditions the actual range might tighten. Pivot arrow targets from chart studies indicate a 1-hour upside target of $4,138 and downside $4,106, while the 4-hour points to $4,130 up and $4,097 down. These levels serve as realistic intraday profit objectives.
| Timeframe | Upside Target | Downside Target |
|---|---|---|
| Daily | $4,589 | $4,482 |
| 4-Hour | $4,130 | $4,097 |
| 1-Hour | $4,138 | $4,106 |
Fundamental Drivers
The only notable data point in the past 24 hours was Japan’s foreign investment in stocks, which slumped to ¥-1 billion for the week ending June 26, down from a previous ¥479.4 billion. This sharp reversal indicates a significant risk-off rotation by Japanese investors, which traditionally benefits gold as a safe haven. Although the data is backward-looking, it helps explain why gold price held firm above $4,100 this week. On the Fed front, the market has priced out immediate rate hikes, but the CME FedWatch tool still shows only a slim chance of a cut until late 2026. This keeps the opportunity cost of holding gold elevated. The DXY is edging lower, lending support, but the correlation is not perfectly inverse in the Asian session, where regional flows dominate.
Key Event to Watch
The single most important event this week is the U.S. Independence Day holiday period, which starts early on July 3 with many desks closing. The real risk follows on Monday, when traders return to a stacked economic calendar including ISM services PMI and the FOMC meeting minutes. Any hawkish surprise from the Fed could quickly push gold price back toward $4,139.90 support. For now, the holiday lull suppresses volatility, but it also increases the risk of a liquidity vacuum causing exaggerated moves.
Devil’s Advocate
The bullish short-term thesis relies on price holding above the $4,182.58 support. A break below this level, particularly on a closing basis on the 1-hour chart, would invalidate the immediate upside bias. In that scenario, gold price could quickly retest the S2 zone at $4,139.90, aligning with the R2 resistance-turned-support level. Moreover, if the RSI rolls over from 61.4 and breaks below 50, momentum would turn bearish, reinforcing a sell-off. Thin liquidity increases the probability of such fakeouts — a sudden headline-driven drop could trap early bulls. Therefore, conservative traders should wait for a definitive acceptance above $4,207.82 before adding long exposure, as failure there would suggest a false breakout and a reversal toward $4,100.
Trading Strategy for Asian Session
Given the low-volume environment, the optimal strategy is a range-bound approach with a bullish bias. An entry zone near $4,190–$4,200 from a pullback to the S1 support area offers a favorable risk-reward. A stop loss should be placed at $4,174, just below the S1 level and within two-thirds of the daily ATR, accounting for noise. The first take-profit target is $4,207.82 (R1). If price breaks and holds above that barrier, traders can trail stops to $4,200 and aim for the daily pivot upside of $4,589, though that level is unlikely to be reached in a single Asian session. A bearish scalp also exists: if price rejects $4,207 strongly, an entry at $4,204 with a stop at $4,212 and a target at $4,182 (S1) respects the likely reversal area. Using the ATR of $25.44, position sizing should be conservative, with no more than 1% risk per trade. For traders who prefer to avoid leverage and maintain full ownership, SmartGoldTrade’s halal gold trading platform offers spot contracts in gram lots, allowing precise position sizing without interest. Furthermore, those who want additional confirmation can consider professional gold trading signals that integrate similar technical levels.
Key Takeaways
- Gold price opens Asian session at $4,126.43, sitting just below R1 resistance at $4,207.82
- Thin liquidity ahead of the U.S. Independence Day weekend increases the risk of false breakouts
- RSI(14) reading of 61.4 leaves room for further upside without overbought extremes
- Key support at $4,182.58 must hold to maintain the short-term bullish structure, with a breakdown exposing $4,139.90
- A confirmed close above $4,207.82 could open the path toward the daily pivot target of $4,589
- The 200-period moving average at $4,299.63 remains the make-or-break level for a long-term trend reversal
Conclusion
Gold’s technical posture is cautiously optimistic as the Asian session unfolds on July 3, 2026. With price above both the 20- and 50-period moving averages, the short-term momentum favors a test of the $4,207.82 resistance level. However, the overarching bearish signal from the 200-period MA at $4,299.63 and the thin holiday liquidity demand a disciplined approach. A failure to sustain a breakout above $4,207 could trigger a swift retracement to $4,182 or lower. Traders should use the quiet session to set up orders rather than chase price, taking advantage of well-defined support and resistance zones. Patience and risk management will be the key differentiators between profitable trades and losses in this environment.
Frequently Asked Questions
- Is gold price likely to break above $4,207 today?
- While the technical setup is bullish, thin Asian session liquidity makes a durable breakout above $4,207.82 uncertain. Traders should wait for a 1-hour close above this level before confirming a breakout.
- What is the best entry level for gold during the Asian session?
- A pullback toward the $4,190–$4,200 zone, near the S1 support of $4,182.58, provides a favorable risk-reward for longs. Aggressive shorts could enter near $4,207 if rejection signals appear.
- How does the 200-day moving average affect gold price?
- The 200-period moving average on the 4-hour chart sits at $4,299.63, and gold remains well below it. This indicates a long-term bear trend; a rally above that level would be required to signal a true bullish reversal.
- Why is the R2 resistance listed lower than S1?
- The level of $4,139.37 reflects a calculated pivot that may have rolled over, but in practice, traders should treat the immediate ceiling at $4,207.82 as the primary resistance. Always combine indicator readings with price action confirmation.
- What impact does thin liquidity have on gold trading?
- Low volume can amplify price moves, leading to sharp spikes that quickly reverse. False breakouts are common, so using wider stops based on ATR ($25.44) and reducing position size is recommended.
Trading Gold (XAU/USD) carries significant risk of loss and is not suitable for all investors. This content is for informational purposes only and does not constitute financial advice. Always conduct your own research and trade responsibly.