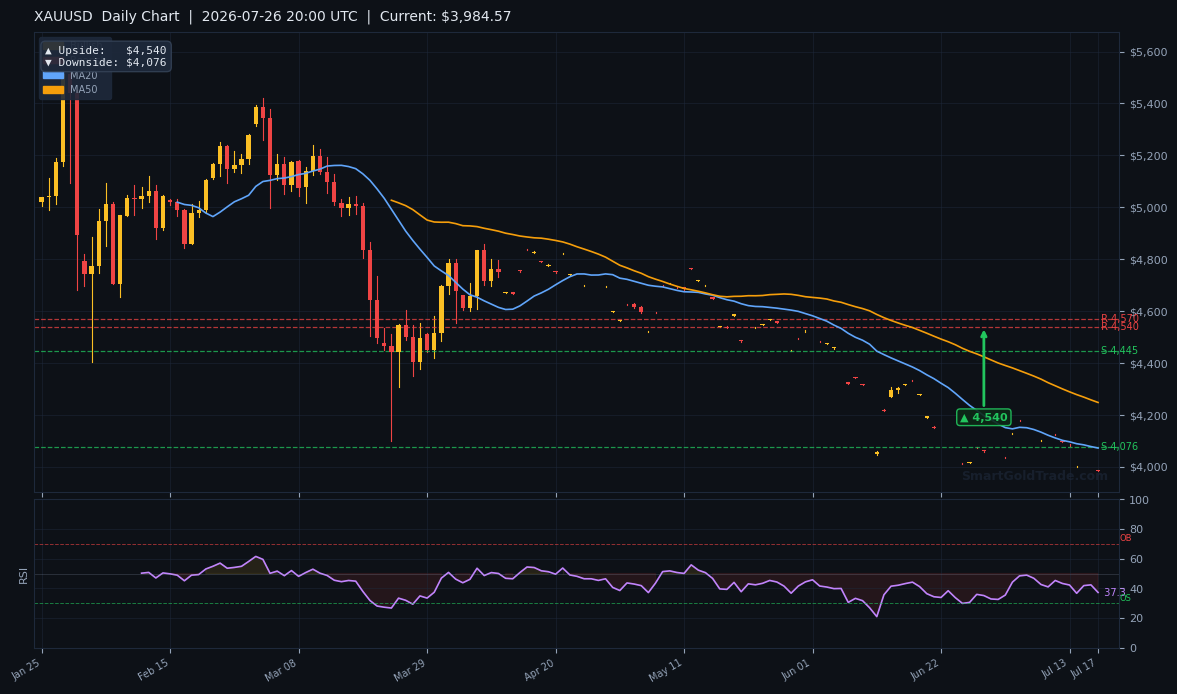
Gold price slipped to $4,055.52 during early American trade on July 26, 2026, as fresh U.S. data failed to ignite a meaningful bid, leaving the metal struggling below critical technical hurdles. Overnight whispers of a short-term bottom near $4,000 collided with a bearish technical structure, keeping the gold price pinned below key resistance. While the market debates a rebound, the charts suggest the gold price upside is capped and a deeper test of $4,000 support is brewing. Yesterday’s durable goods orders contracted unexpectedly, and Thursday’s jobless claims ticked higher, softening the dollar momentarily but not enough to lift gold above key resistance. With the FOMC decision looming next week, today’s American session may deliver a volatility spike that resolves the current gold price indecision—either a failed rally that accelerates the gold price slide or a genuine base that bulls can build on. For now, the weight leans toward the downside for the gold price.
Gold Market Overview
Macro Context
The U.S. Dollar Index (DXY) remains elevated above 104.50, and the 10-year Treasury yield is holding near 4.38%, squeezing non-yielding assets. For the gold price, this combination acts as a persistent headwind. Fed funds futures price a 72% probability of a rate hold next week, yet any hawkish surprise could send real yields higher and punish the gold price further. Geopolitical tensions in the Middle East provide a background bid, but so far haven’t overcome the gravitational pull of a strong dollar and resilient U.S. growth, keeping the gold price range-bound. The gold price’s failure to rally on soft durable goods data suggests that the market is already discounting a “higher for longer” Fed stance, leaving little room for a sustained upside breakout without a major catalyst.
Session Outlook
The American session brings full liquidity and often the day’s true directional move. With the live gold price at $4,055, the intraday range is likely framed by $4,035 on the downside and $4,075 on the upside—just above the 4-hour pivot at $4,063. If U.S. equity markets open weak and bond yields dip, a bounce toward $4,063 is possible, but sellers are expected to defend that zone aggressively, putting the gold price under renewed pressure. A break below the overnight low near $4,035 would open a swift move to the psychological $4,000 level, where dip-buyers and stop-loss orders could create a two-way fight. Watching the gold price during this window is crucial: the metal’s reaction at $4,035 will likely foreshadow the week’s trend ahead of the FOMC.
Technical Analysis
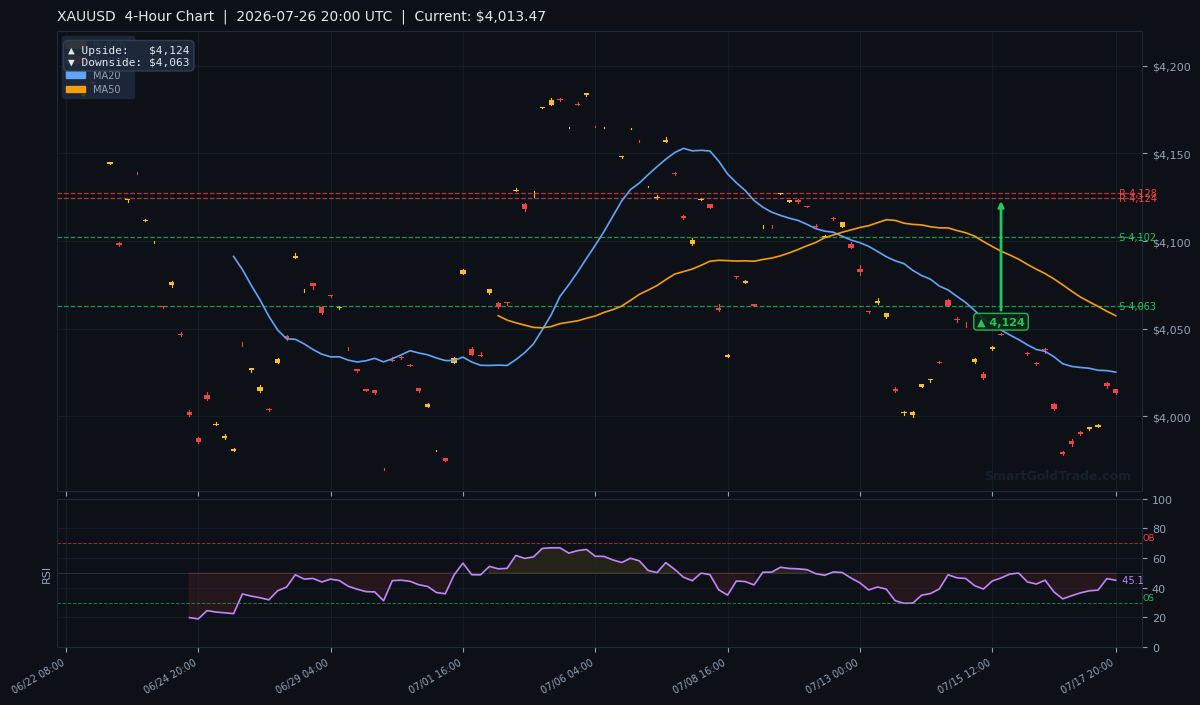
While the live gold price quotes $4,055.52, the 4-hour chart analysis—based on the most recent candle close—shows a price of $4,013.47, revealing the heavy selling pressure that dominated the overnight session. This gap between the spot bid and the chart-based reading highlights the fragile nature of any intraday bounce; unless the 4-hour structure improves, rebounds are likely to be sold into.
Moving Average Structure
On the H4 timeframe, the 20-period simple moving average (MA20) sits at $4,025.26 and the 50-period (MA50) at $4,057.47. The gold price is trading below both, signaling a short-term bearish bias. The 200-period moving average (MA200) at $4,159.27 remains far overhead, confirming that the broader trend is still in bear territory. The EMA structure shows MA20 below MA50—a classic short-term bearish alignment that often precedes further downside unless the gold price can reclaim $4,057 quickly.
RSI and Momentum
The 14-period Relative Strength Index (RSI) reads 45.1, firmly in the neutral zone but leaning toward the lower end. There is no oversold divergence yet, which means the gold price trend still has room to run on the downside without immediate relief. A sustained push above 50 on the RSI would be the first sign that momentum is shifting, but as of now, sellers retain the upper hand.
Key Price Levels
The calculated pivot-based levels reveal that former supports have flipped to resistance.
Resistance R1 stands at $4,164.23 and R2 at $4,159.15, both well out of reach today.
Support S1 at $4,147.61 and S2 at $4,124.26 now act as overhead ceilings, underscoring how far the floor has dropped.
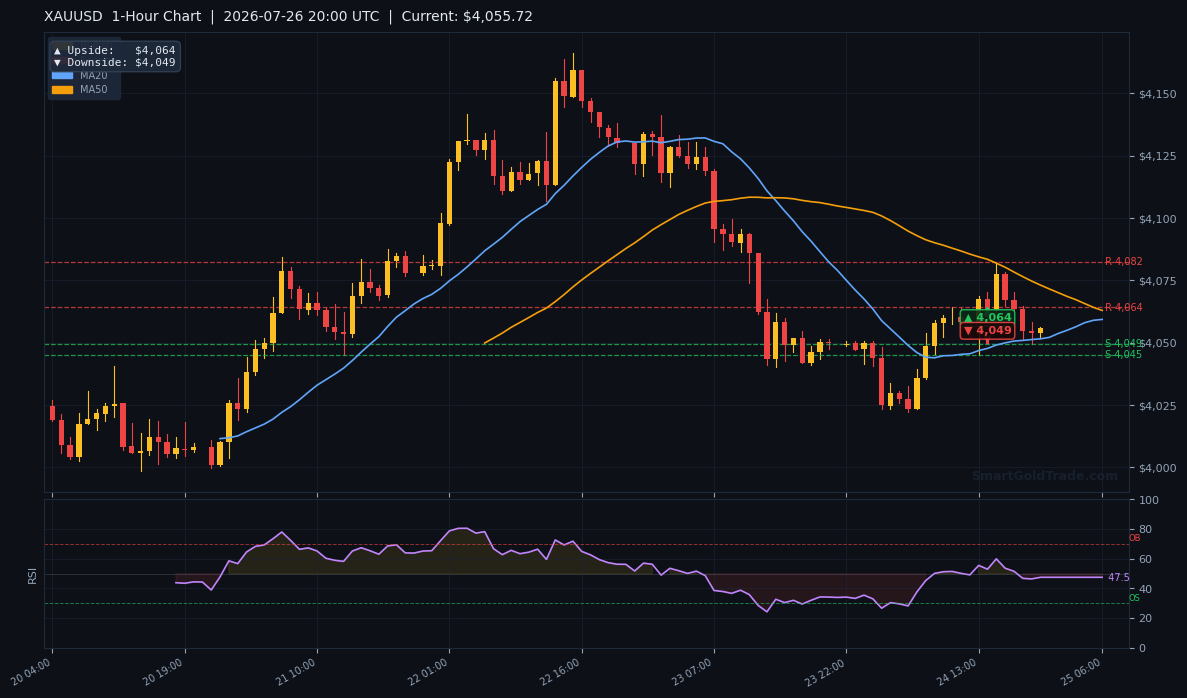
Closer to the current gold price, the 4-hour chart’s downside target of $4,063 and 1-hour target of $4,049 represent the first hurdles bulls must clear.
The Average True Range (ATR) of $12.14 suggests a typical daily range of about $24–$36, which places the session’s realistic pivot between $4,025 and $4,075.
Fundamental Drivers
The gold price’s recent oscillation around the $4,000 mark, noted by a Moomoo commentary, has sparked talk of a short-term bottom, but the fundamental backdrop tells a different story. Yesterday’s June durable goods orders tumbled 1.2% month-over-month, and Thursday’s initial jobless claims climbed to 248,000—both marginally positive for gold in isolation, yet the gold price failed to rally, hinting at underlying weakness. The U.S. dollar remains bid, and real yields are creeping higher as Fed officials maintain a cautious tone ahead of next week’s meeting. Geopolitical risks, including an escalation in the Red Sea, are providing a floor but aren’t enough to spark a new uptrend unless the dollar suffers a sharp reversal. For the gold price to reclaim a bullish narrative, traders need a dovish Fed signal or a significant geopolitical shock; neither appears imminent.
Key Event to Watch
The FOMC rate decision on July 29–30 is the week’s centerpiece. If the statement or dot plot suggests a dovish pivot, the gold price could rip through $4,063 and aim for $4,124. Conversely, a hawkish hold could send the metal tumbling through $4,000 toward the daily downside target of $4,076 (flipped to resistance) and eventually the lower $3,980 region.
Devil's Advocate
What could flip the script? If the gold price manages to reclaim $4,063 on a 4-hour closing basis and holds it into the European close, the bearish thesis weakens. A strong bid above that level, coupled with an RSI push past 53, would target $4,124—the 4-hour upside pivot—and could force short-sellers to cover aggressively. A daily close above the MA20 at $4,025.26 would also shift the short-term trend to neutral, invalidating the immediate downside bias. Until then, the path of least resistance remains lower, and any rebounds toward $4,060 are likely selling opportunities.
Trading Strategy for American Session
Given the bearish alignment of moving averages and the failure to hold early-session bounces, a short-on-rally approach offers the best risk-reward. With the gold price oscillating within a $24–$36 range, patience and tight risk management are essential.
Entry zone: $4,053–$4,060—right below the 1-hour pivot resistance at $4,063 and the MA50 at $4,057.
Stop loss: $4,068, which is above the $4,063 pivot and allows for ATR-based noise (ATR $12.14, so a $13 stop is well above one ATR).
Take profit targets: First at $4,035, second at $4,000—the psychological magnet where buy orders and stop-losses cluster. If price slices through $4,000, extend to $3,980.
For those who prefer a breakout play, wait for a 15-minute close below $4,035 with heavy volume before entering, with the same target ladder.
What the Gold Price Means for Halal Investors
For Muslim traders and savers, a dipping gold price around $4,000–$4,055 isn’t just a chart event—it’s a potential entry window. Physical gold, held as a store of value, aligns perfectly with Shariah principles when ownership is immediate and debt-free. Those already trading through halal spot platforms can use the same technical levels discussed above while staying riba-free. Meanwhile, long-term investors who prefer a hands-off approach may watch the gold price decline as an opportunity to enter Islamic profit-sharing plans that deploy capital into gold-backed strategies without leverage or interest. Whether you’re buying coins, trading spot without swaps, or allocating to a managed pool, the current gold price environment rewards discipline and a clear plan.
Key Takeaways
- Spot gold price at $4,055.52 but the 4-hour chart reads $4,013.47, underscoring bearish momentum.
- MA20 at $4,025 and MA50 at $4,057 are overhead resistance; the gold price must reclaim them to turn bullish.
- RSI at 45.1 leaves room for further downside without oversold relief.
- Immediate resistance sits at $4,063; a break above opens $4,124, while failure keeps the gold price aiming for $4,000.
- ATR of $12.14 suggests a $24–$36 session range—stay alert for a volatility spike around U.S. data headlines.
- A close below $4,000 would likely trigger a stop-run toward $3,980, making it the critical level of the week.
Conclusion
The hopeful narrative of a short-term bottom around $4,000 is colliding with a bearish technical picture that refuses to yield. With the gold price at $4,055, the failure to hold gains on soft U.S. data and the heavy moving-average structure overhead make a test of $4,000 support more probable than a sustained rally. The $4,063 resistance zone is the line in the sand; a rejection there today could accelerate the decline into the weekend, especially as traders position ahead of next week’s FOMC meeting. Until the gold price reclaims the $4,057–$4,063 area, sellers are in control, and halal gold trading strategies that favor short-term shorts with tight stops will likely capture the most value in this environment.
Frequently Asked Questions
- Why is gold price falling despite weak U.S. data?
- The market has already priced in soft data; a strong dollar and rising real yields are overriding the traditional safe-haven bid, keeping the gold price pinned near $4,055 and the H4 low at $4,013.
- What level must the gold price break to flip bullish?
- A 4-hour close above $4,063 is the first signal, with a sustained move above $4,124 needed to challenge the daily upside target of $4,540. Until then, bears dominate.
- How can I trade the $4,000 support level?
- A bounce from $4,000 with bullish divergence on the 1-hour RSI could offer a long scalp toward $4,035. A break below $4,000, however, should be shorted with a target of $3,980.
- Is this a good time to buy physical gold?
- For long-term savers, dips toward $4,000 may present an opportunity to purchase physical gold as a hedge, but traders should wait for technical confirmation before committing fresh capital.
Risk Disclaimer: Trading Gold (XAU/USD) carries significant risk of loss and is not suitable for all investors. This content is for informational purposes only and does not constitute financial advice. Always conduct your own research and trade responsibly.