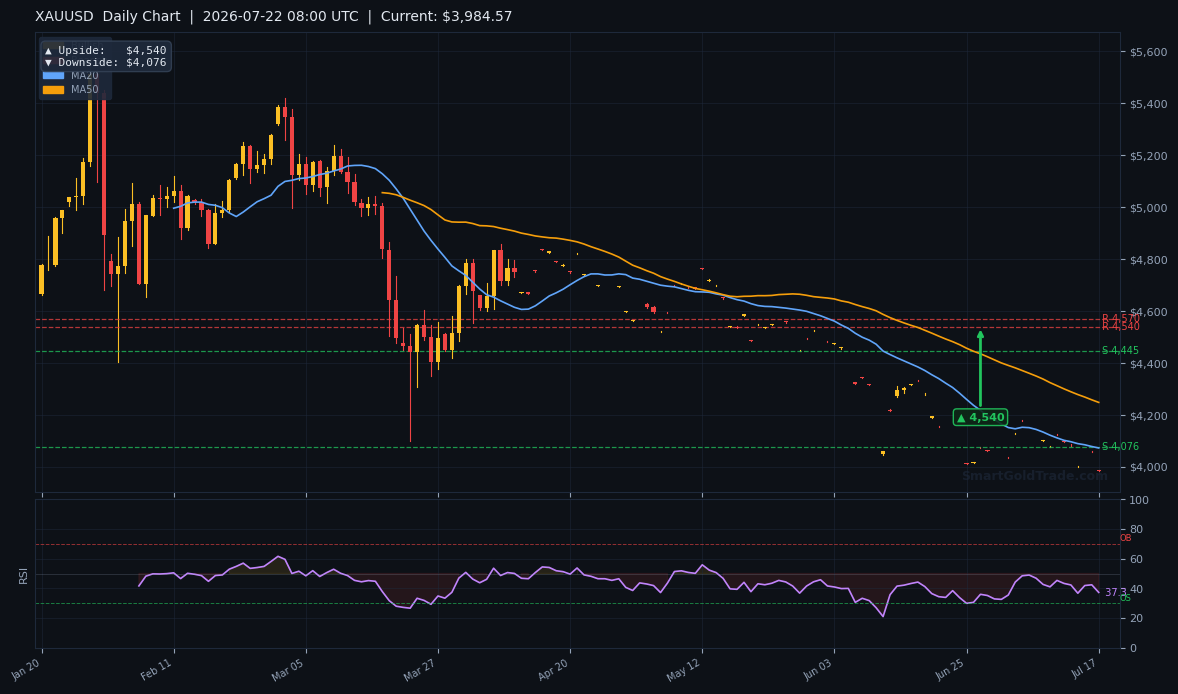
Gold price has surged to $4,117.55 per troy ounce as of 08:30 UTC on July 22, 2026, extending a sharp recovery from an Asian-session low of $4,013.47. The rally was fuelled by renewed bets on Federal Reserve rate cuts after last week’s cooler‑than‑expected U.S. producer price data kept the dollar under pressure. With London liquidity entering the market, the gold price is now testing critical levels that could define the next leg of the move.
Gold Price Overview
Macro Context
The gold price rebound was supported by a weaker U.S. Dollar Index (DXY), which drifted lower toward 98.5, and a drop in benchmark 10‑year Treasury yields to 3.45%. Falling real yields reduce the opportunity cost of holding non‑yielding assets like gold. Geopolitical unease in the Middle East continues to offer intermittent safe‑haven flows, while the June PPI print of −0.2% month‑over‑month undershot forecasts and reinforced expectations that the Fed may pivot before year‑end.
Session Outlook
The European session typically brings deeper liquidity and can amplify breaks that occurred during Asia’s thinner hours. With the gold price already reclaiming the $4,100 handle, the path higher stays intact as long as prices hold above $4,057.47 (the 50‑period moving average).
The ATR of $12.14 suggests a daily range of roughly $4,098.52–$4,122.80, placing the $4,124.26 resistance right at the upper boundary — a break north could trigger acceleration. Key European triggers include any ECB commentary and Thursday’s flash PMI data, but today’s focus will be squarely on price action around the $4,124 pivot.
Gold Price Technical Analysis
Moving Average Structure
The H4 chart at 08:00 UTC closed at $4,013.47, below all three key moving averages — a bearish configuration at that moment. The 20‑period MA stands at $4,025.26, the 50‑MA at $4,057.47, and the 200‑MA at $4,159.27.
However, the gold price recovery above the 20‑ and 50‑MAs has flipped the short‑term trend to neutral‑to‑bullish, provided the gains hold into the London fix. A sustained stay above the 200‑MA would be required to turn the medium‑term picture bullish.
RSI and Momentum
The 14‑period Relative Strength Index reads 45.1, squarely in neutral territory. This leaves ample room for the gold price to push higher before overbought conditions emerge (typically above 70). Momentum oscillators are not yet flashing exhaustion, meaning the intraday rally still has gas in the tank.
Key Price Levels
Support levels S1 at $4,147.61 and S2 at $4,124.26 — previously magnets for bids — now serve as resistance. Above them, resistance stands at R2 $4,159.15 and R1 $4,164.23. The ATR‑based expected range for the session is $4,098.52 to $4,122.80, highlighting that a break of the gold price above $4,124.26 would signal a volatility expansion.
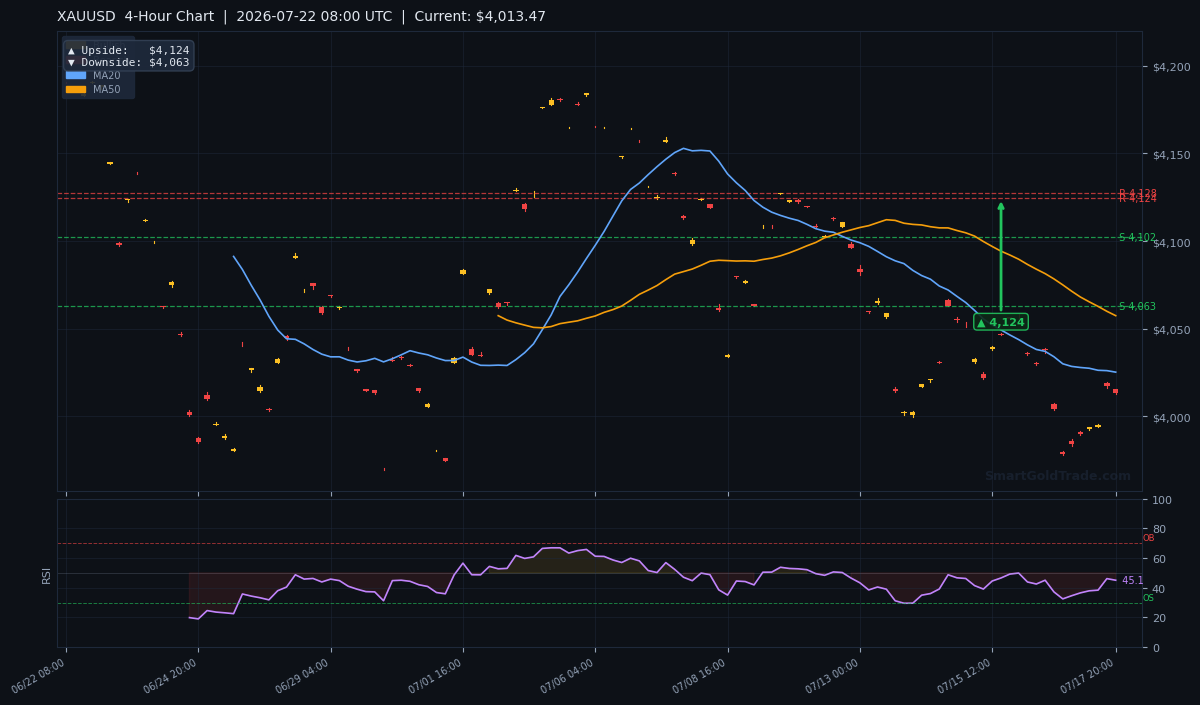
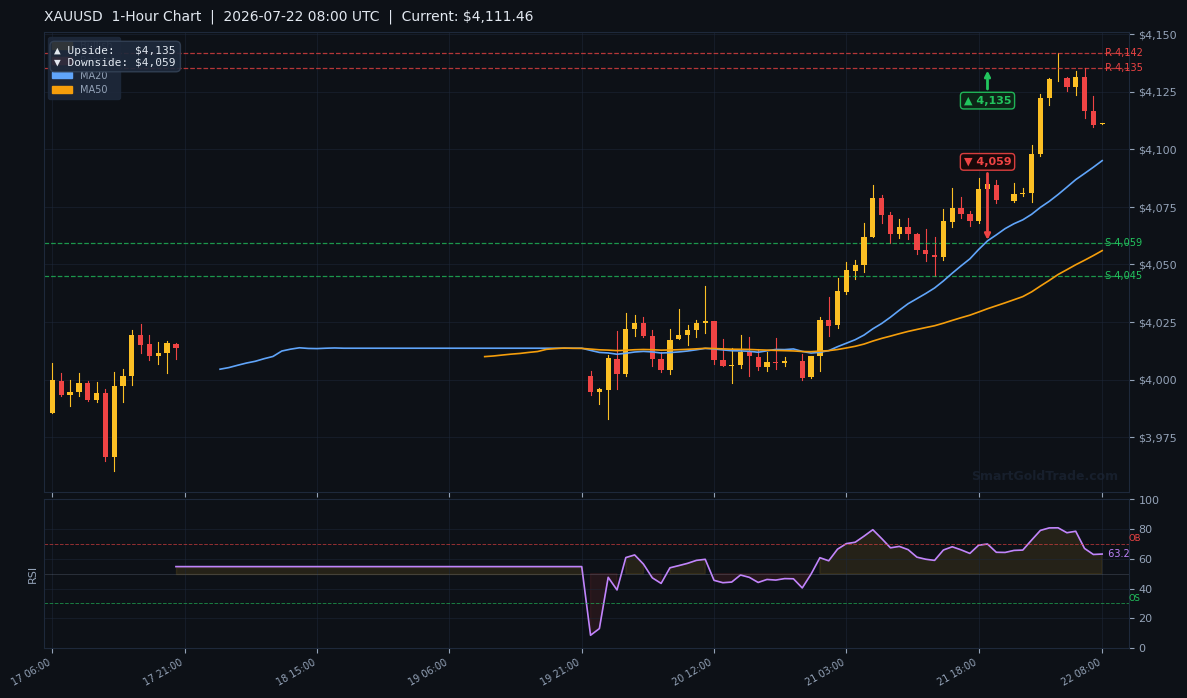
The 1‑hour chart shows a series of higher lows since the Asian trough, with the 1‑hour upside target at $4,135 and the 4‑hour upside target at $4,124. The confluence of the 4‑hour target and S2 makes $4,124.26 the make‑or‑break level for today’s gold price.
Fundamental Drivers
The EUR/JPY cross snapped a three‑day losing streak on Tuesday, attracting dip‑buyers near the 186.00 mark. This risk‑on move, reflecting renewed appetite for carry trades, could jostle with gold’s safe‑haven appeal.
However, a softer DXY and falling real yields are providing a more direct catalyst for the gold price push higher. Last week’s soft PPI print has emboldened rate‑cut bets, and every dip in the dollar is being met with fresh gold buying.
Key Event to Watch
The most critical upcoming event is Thursday’s preliminary July Manufacturing and Services PMI figures. A downside surprise could cement recession fears and turbocharge the gold price rally toward $4,159. Robust numbers, conversely, might cap the move and trigger a retest of the 50‑MA. Until then, the macro backdrop of a weak dollar and falling yields supports the bullish bias.
How the Gold Price Affects Islamic Investors
For Shariah‑conscious traders, every gold price tick carries significance beyond technical charts. The spot gold price serves as the benchmark for profit‑and‑loss sharing in structures like mudarabah and musharakah, directly influencing returns in Islamic gold investment pools.
A rising gold price enhances potential profit shares for long‑term investors, while sharp pullbacks often create buying opportunities for physical gold — a tangible store of value permitted under Islamic law. Because the gold price is the common denominator across halal trading, investment pools, and physical bullion, today’s move is relevant for anyone building wealth the Shariah‑compliant way.
This dual significance — technical trade setup and Islamic investment benchmark — makes the gold price a unique asset to watch. Whether you’re scalping intraday moves or accumulating for the long haul, the current gold price environment offers something for every disciplined, riba‑free strategy.
Devil’s Advocate
The bullish thesis hinges on the gold price holding above the $4,057.47 (50‑MA) barrier. A failure to clear $4,124.26 would risk a swift reversal back below that level, invalidating the intraday breakout.
If the session high stalls and the gold price slips below $4,057, bears could target the 4‑hour downside pivot at $4,063 and then the Asian low of $4,013.47. The trigger for a bearish flip would be a decisive hourly close below $4,057, opening a path to the 200‑MA at $4,159.27 — though that move would be counter‑trend and unlikely absent a sudden DXY spike.
Trading Strategy for European Session
For today’s gold price action, I favour buying on a shallow pullback toward the $4,100–$4,110 zone, with a stop‑loss placed at $4,098 (just below the ATR lower boundary). Take‑profit targets stand at $4,124.26 (S2 resistance) and $4,147.61 (S1 resistance). For breakout traders, a 4‑hour close above $4,124.26 would set the stage for a run to $4,159.15 and $4,164.23.
Those seeking additional confirmation may monitor professional gold trading signals for real‑time precision. Because SmartGoldTrade offers interest‑free spot gold trading, all strategies can be executed without riba, aligning with Islamic finance principles.
Key Takeaways
- Gold price rallied from $4,013.47 to $4,117.55, reclaiming the 20‑MA ($4,025.26) and 50‑MA ($4,057.47).
- Immediate resistance at $4,124.26 (S2) must be cleared to confirm bullish momentum.
- RSI(14) at 45.1 leaves ample room for the gold price to rise before overbought conditions emerge.
- ATR of $12.14 implies a session range of $4,098.52–$4,122.80; a break above $4,124.26 would signal acceleration.
- The 200‑MA at $4,159.27 looms as a formidable barrier; a close above would shift the medium‑term trend.
- Key support to watch is $4,057.47; losing this level would likely trigger a retest of $4,063 then $4,013.47.
Conclusion
The gold price’s dramatic intraday reversal has injected bullish momentum, but the $4,124.26 resistance remains the gatekeeper. A sustained break above this level would target $4,147.61 and eventually the 200‑day moving average at $4,159.27.
As London deepens, volatility is expected to rise, and traders should remain nimble. With the DXY under pressure and rate‑cut expectations simmering, the bias points higher so long as $4,057.47 holds.
For those looking to harness this move, consider familiarizing yourself with our physical gold products as a long‑term hedge, or explore Shariah‑compliant strategies available on the platform.
FAQ
- Why did gold price surge today?
- Gold price spiked from an Asian low of $4,013.47 to $4,117.55 as a weaker U.S. dollar and last week’s soft PPI data fuelled rate‑cut expectations, encouraging bargain buying above the 50‑MA.
- What is the next resistance for gold price?
- The next decisive resistance is $4,124.26 (S2). A close above that would open a path toward $4,147.61 and then the 200‑MA at $4,159.27.
- Where should I place a stop‑loss on a gold long trade?
- For a long around the $4,100–$4,110 zone, a stop below $4,098 protects against a false breakout. A wider stop at $4,057 would safeguard against a deeper dip.
Risk Disclaimer: Trading Gold (XAU/USD) carries significant risk of loss and is not suitable for all investors. This content is for informational purposes only and does not constitute financial advice. Always conduct your own research and trade responsibly.