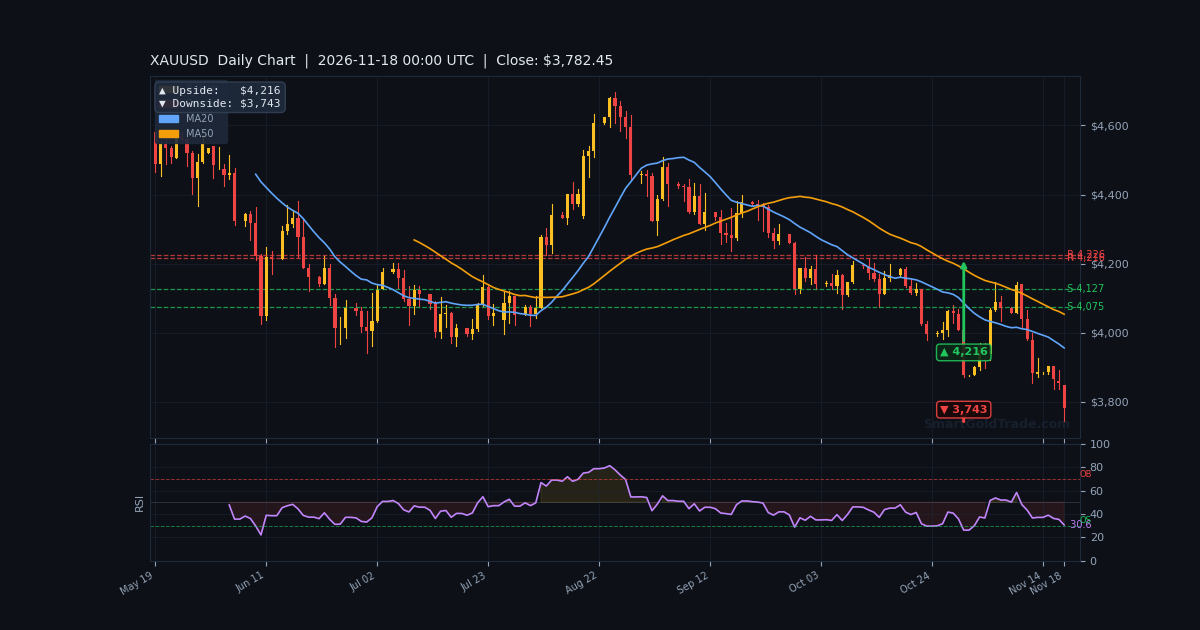
The gold price has collapsed to $3,743.58, a level not seen since September 2025, as the American Session opens with bears firmly in control. This morning's European rout accelerated after Fed Governor Christopher Waller warned that inflation is worsening and floated a 50-basis-point December hike. The dollar surged to a 19-month high, crushing gold's appeal. With the FOMC October meeting minutes due in just five hours, traders face a binary event: a hawkish confirmation that extends the selloff, or a less aggressive tone that triggers a violent short-covering bounce. The gold price sits dangerously close to $3,742.82, today's low and the immediate make-or-break support.
Gold Market Overview
Macro Context
The macro backdrop is unambiguously bearish for the gold price. The broad dollar index has climbed to 122.7, up 1.1% week-over-week, hitting its highest level since April 2025. The 10-year TIPS real yield has risen to 2.92%, a 0.29% weekly jump, while the nominal 10-year yield holds above 5.12%. These rising real yields are the single biggest headwind for a non-yielding asset like gold. Fed funds futures now fully price a December hike, with a 70% chance of another in January. The market sentiment score is -0.36, reflecting a hawkish, risk-on tilt. Geopolitical tensions have taken a backseat as the Fed's inflation fight dominates. Even strong physical demand from India and GLD inflows of 2.6 tonnes daily are being overwhelmed by the macro tide.
Session Outlook
The American Session will be defined by the FOMC minutes release at 19:00 GMT. Liquidity is already thinning as traders position defensively. The ATR(14) of $17.23 suggests an expected hourly range of roughly 0.46%, but event risk could easily double that. Conversely, a balanced or cautious tone could spark a sharp bounce toward the VWAP at $3,789.14. Expect choppy, headline-driven trading until the minutes drop.
Technical Analysis
Moving Average Structure
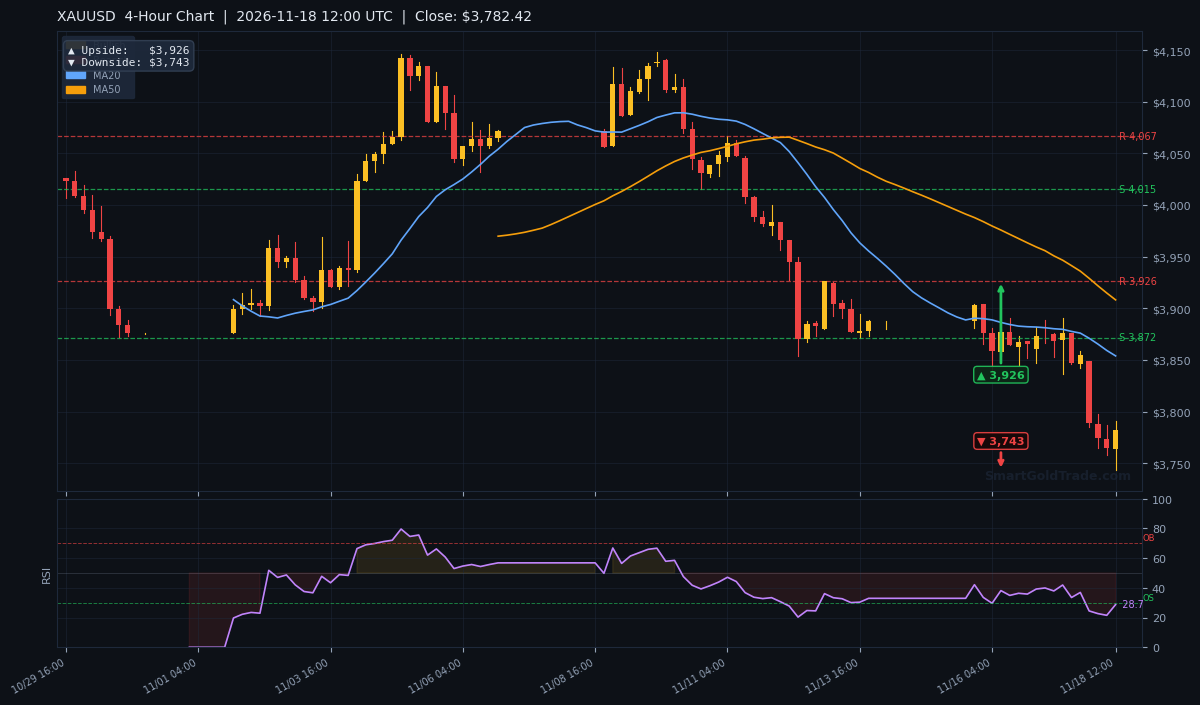
The moving average structure is textbook bearish. The gold price is trading far below all key EMAs: EMA20 at $3,798.56, EMA50 at $3,833.95, and EMA200 at $3,926.94. The EMA20 is below the EMA50, and both are below the EMA200, confirming a strong downtrend across all timeframes. On the H4 chart, the close is $3,743.60, well below the H4 EMA50 of $3,917.68. The D1 close at $3,743.74 is similarly bearish, sitting below the D1 EMA50 of $4,087.78. This alignment of lower highs and lower lows on the daily and 4-hour charts reinforces the bearish bias.
RSI and Momentum
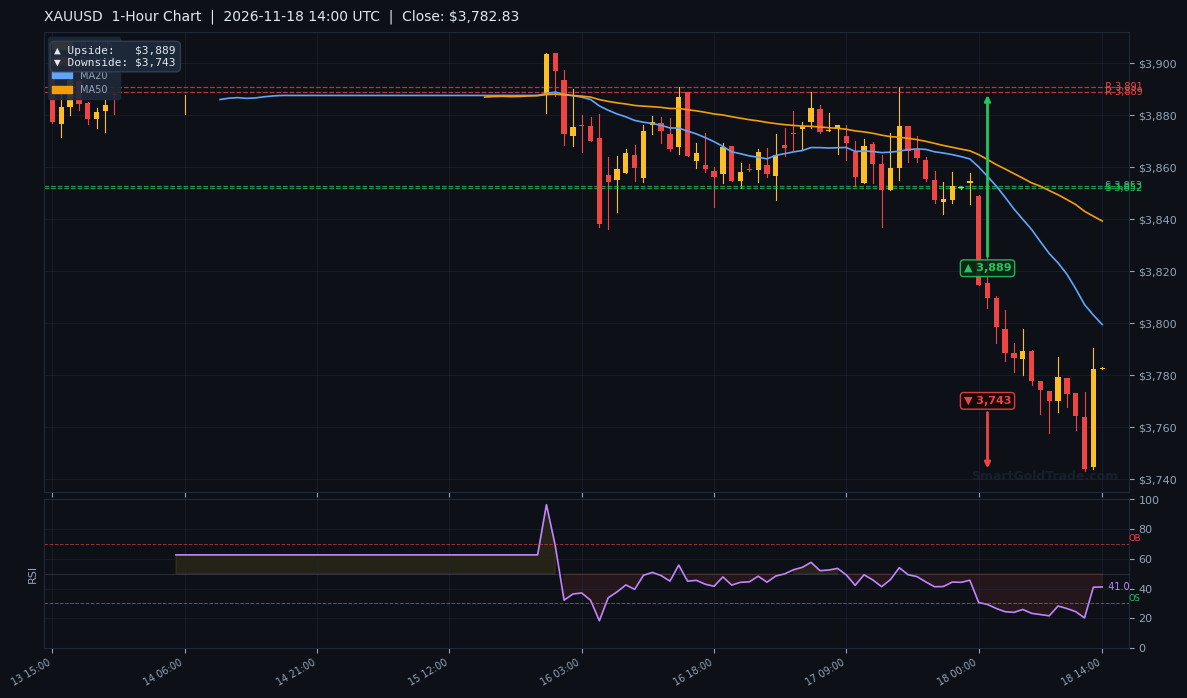
The RSI(14) on the H1 chart has plunged to 20.0, deep into oversold territory. While this often precedes a bounce, in strong downtrends, RSI can remain oversold for extended periods. The Stochastic oscillator reads 7.6/12.7, also oversold. The MACD histogram is negative at -4.42, with the MACD line at -26.27 below its signal at -21.85, confirming bearish momentum. The ADX at 33.6 indicates a strong trend, with the -DI at 35.25 far above the +DI at 11.17, showing bears are in control. Any bounce from oversold conditions should be treated as a selling opportunity until momentum diverges.
Key Price Levels
Immediate support is S1 $3,742.82, today's low and a critical pivot. Resistance is R1 $3,886.69 and R2 $3,888.93, both strong levels with 3 touches each. The Bollinger Bands show the lower band at $3,732.24, just below current price, suggesting limited room before a mean-reversion bounce. The VWAP at $3,789.14 acts as a magnet for any recovery. The expected session range based on ATR is roughly $17, but event risk could expand this to $30-$40. The Fibonacci 61.8% retracement at $3,857.55 is the nearest major upside hurdle.
Fundamental Drivers
The dominant fundamental driver is the Federal Reserve's hawkish pivot. This morning, Fed Governor Waller stated that inflation is "heading in the wrong direction" and suggested the Fed should hike 50 basis points or signal faster increases. This follows solid US retail sales data on Tuesday, which showed consumption remains resilient. The dollar index's surge to a 19-month high and the 10-year yield above 5% are direct consequences. While GLD holdings rose 2.6 tonnes and COT data shows speculators net long 190,107 contracts, these are lagging indicators. The immediate flow is driven by rate expectations. The market sentiment score of -0.36 confirms the bearish tilt. Rising real yields are the primary mechanism suppressing the gold price.
Key Event to Watch
The FOMC October meeting minutes, due at 19:00 GMT (in 5 hours), are the single most important event this week. Traders will scrutinize the document for the degree of consensus around further hikes. A balanced tone could trigger a short-covering rally toward $3,789.14. Given the market's already hawkish pricing, the bar for a dovish surprise is lower, making a bounce more likely if the minutes are not aggressively hawkish.
Unified Technical & Fundamental Outlook
Both pillars are aligned bearish. The technical pillar scores -0.92, reflecting a strong downtrend with price below all EMAs and negative MACD. The fundamental pillar scores -0.32, driven by rising real yields, a strong dollar, and hawkish Fed rhetoric. The combined score is -0.62, with alignment classified as ALIGNED_BEARISH. This confluence is powerful and suggests that any rallies will be sold. The only note of caution is the oversold RSI at 20.0, which could produce a sharp but temporary bounce. However, the weight of evidence points to further downside unless the FOMC minutes deliver a significant dovish surprise.
Devil's Advocate
What could invalidate the bearish bias? A less hawkish-than-expected FOMC minutes could spark a violent short squeeze, given the extreme oversold conditions. The gold price is sitting just above the lower Bollinger Band at $3,732.24, and a bounce toward the VWAP at $3,789.14 is plausible. Additionally, physical demand from India and GLD inflows suggest underlying support. If the minutes show concerns about growth or a divided committee, the dollar could retreat, lifting gold. A daily close above $3,789.14 would neutralize the immediate bearish momentum and shift focus to $3,833.95.
Trading Strategy for American Session
Given the aligned bearish signals, the primary strategy is to sell rallies. An entry zone near $3,764.12-$3,773.40 (below the EMA20 and VWAP) offers a favorable risk-reward. Place a stop loss above $3,789.14 (VWAP) or at $3,798.56 to account for volatility. Alternatively, if the minutes are dovish and price breaks above $3,789.14, a long scalp toward $3,833.95 (EMA50) is possible with a stop at $3,773.40. Position size should be reduced due to event risk. For automated execution, consider a news event trading protection tool to pause trades during the minutes release. For those looking to own physical gold at these depressed levels, SmartGoldTrade offers certified gold coins and bars.
Key Takeaways
- The gold price is at $3,743.58, down 2.87% today, the lowest since September 2025.
- RSI(14) at 20.0 is oversold, but trend remains strongly bearish with ADX 33.6.
- The dollar index at 122.7 and 10-year yield above 5.12% are major headwinds.
- FOMC minutes at 19:00 GMT is the key catalyst; a hawkish tone could accelerate selling.
- Technical and fundamental pillars are aligned bearish with a combined score of -0.62.
Conclusion
The gold price is under severe pressure, trading at $3,743.58 with both technical and fundamental forces aligned bearish. The path of least resistance remains down, with $3,742.82 as the critical line in the sand. Traders should focus on selling rallies into resistance, with tight risk management around the event. The oversold RSI warrants caution against chasing the downside aggressively. For those looking to diversify into physical assets, SmartGoldTrade's Shariah-compliant gold investment pools offer a long-term alternative. Stay nimble and let the minutes dictate the next move.
Frequently Asked Questions
- What is the current gold price?
- The gold price is $3,743.58 as of the American Session open on November 18, 2026.
- Why is gold falling today?
- Gold is falling due to a hawkish Fed, with Governor Waller floating a 50bp hike, a surging dollar at 122.7, and 10-year yields above 5.12%.
- What is the key support level for gold?
- The immediate support is $3,742.82, today's low.
- What is the FOMC minutes and when is it released?
- The FOMC October meeting minutes are released at 19:00 GMT today. A hawkish tone could push gold below $3,742.82, while a dovish tone could lift it to $3,789.14.
- Is it a good time to buy gold?
Risk Disclaimer: Trading Gold (XAU/USD) carries significant risk of loss and is not suitable for all investors. This content is for informational purposes only and does not constitute financial advice. Always conduct your own research and trade responsibly.