The gold price is holding at $4,175.21 during Friday's Asian session, extending this week's rebound from the $4,103.45 low as traders digest Wednesday's hawkish Fed minutes. The metal has climbed 1.04% today, but momentum indicators are flashing caution.
President Trump's Thursday remarks that Washington will not strike Iran before the November midterms cooled safe-haven demand, yet gold shrugged off the geopolitical relief. Instead, bulls are leaning on the technical structure above the EMA200 at $4,165.50.
With Asian liquidity thin and RSI(14) at 71.4, this session favors preparation over chasing. Let's map the levels that matter before London arrives.
Gold Market Overview
Macro Context
The dollar remains on the back foot after Fed Governor Waller hinted Thursday that rate hikes need not arrive at consecutive meetings — opening the door for an October pause. The CME FedWatch tool now prices just a 17.7% chance of an October hike versus 81.3% for December.
That ambiguity is gold's friend. Meanwhile, 10-year Treasury yields pulled back to 5.23% from a 24-year high of 5.35%, easing the opportunity-cost pressure that crushed gold earlier this week. St. Louis Fed President Musalem's call for "more monetary policy firming" keeps the hawkish bias alive, though.
Geopolitically, Trump's Iran de-escalation removed a tail risk premium. Copper holding near record highs also signals industrial demand strength — a mixed backdrop for metals.
Session Outlook
Asian hours offer the thinnest liquidity of the day, and with ADX at 18.4 (weak/ranging), expect chop between $4,165 and $4,180 until Tokyo hands off to London. The ATR(14) of $14.91 suggests a contained hourly range of roughly 0.36%.
Watch for a break above $4,179.69 (R1) to trigger momentum buying, or a slip below $4,165.69 (S1) to invite profit-taking. Do not chase spikes in this thin tape.
Technical Analysis
Moving Average Structure
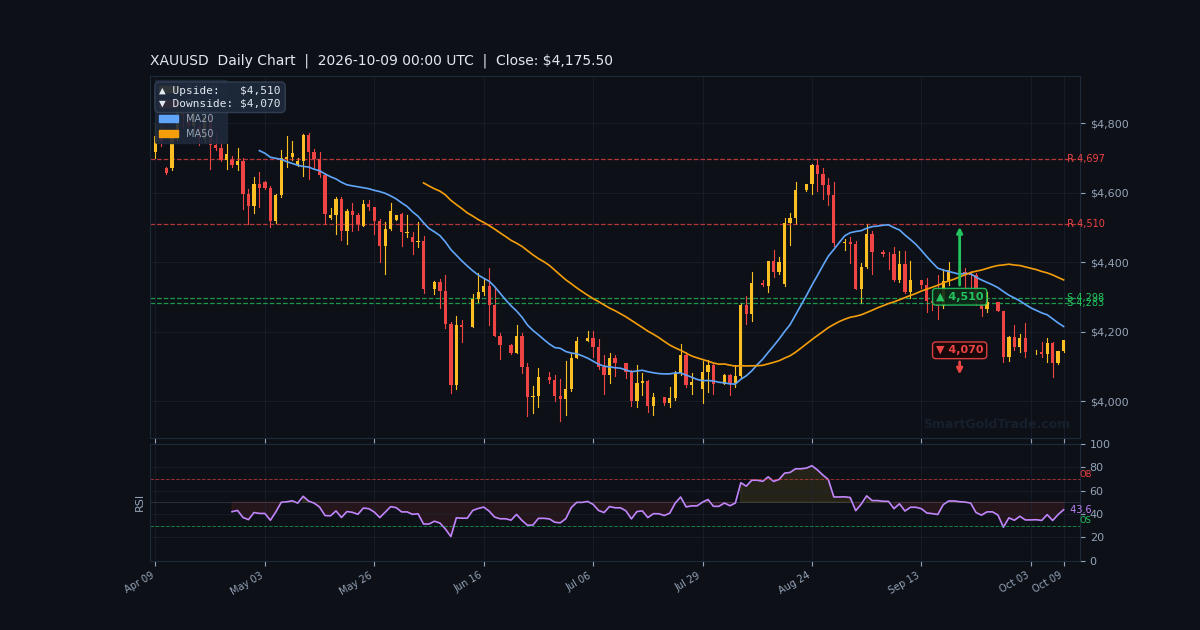
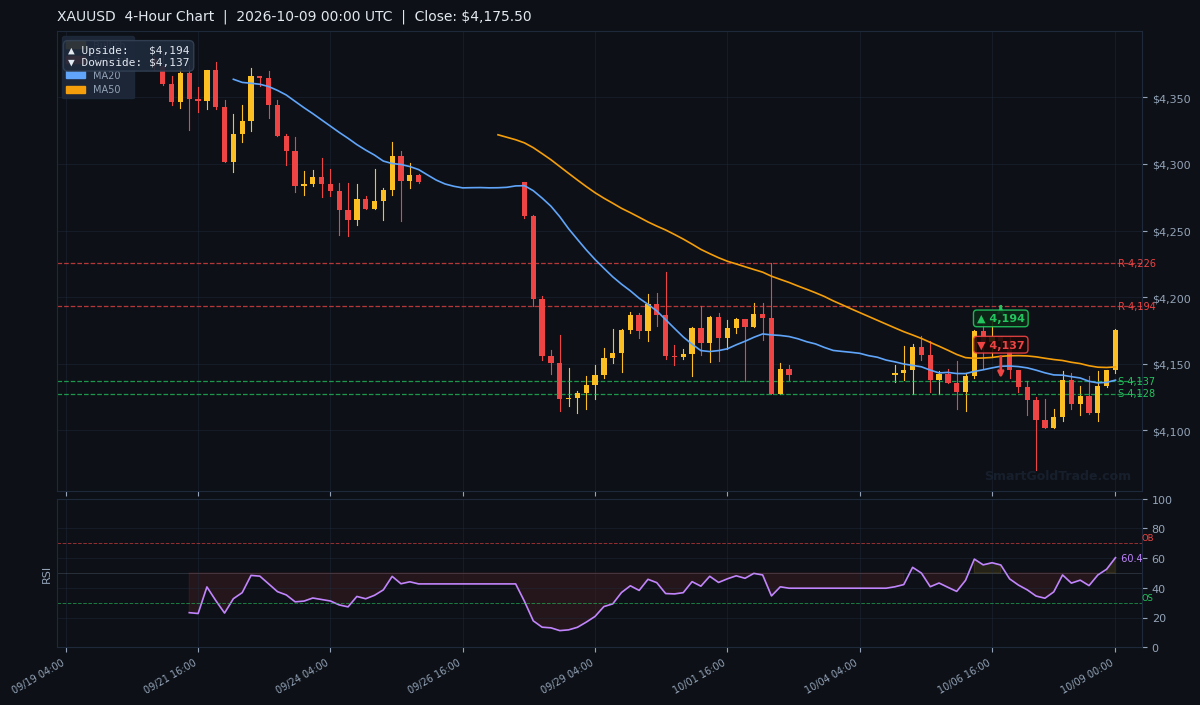
Price sits above all three key averages: EMA20 at $4,134.10, EMA50 at $4,131.78, and crucially EMA200 at $4,165.50. That alignment confirms a bullish structure, though the higher-timeframe EMA200 on H4 ($4,264.01) and D1 ($4,303.37) still sit overhead as major resistance.
The VWAP at $4,153.81 acts as the intraday bull/bear line — holding above it keeps buyers in control.
RSI and Momentum
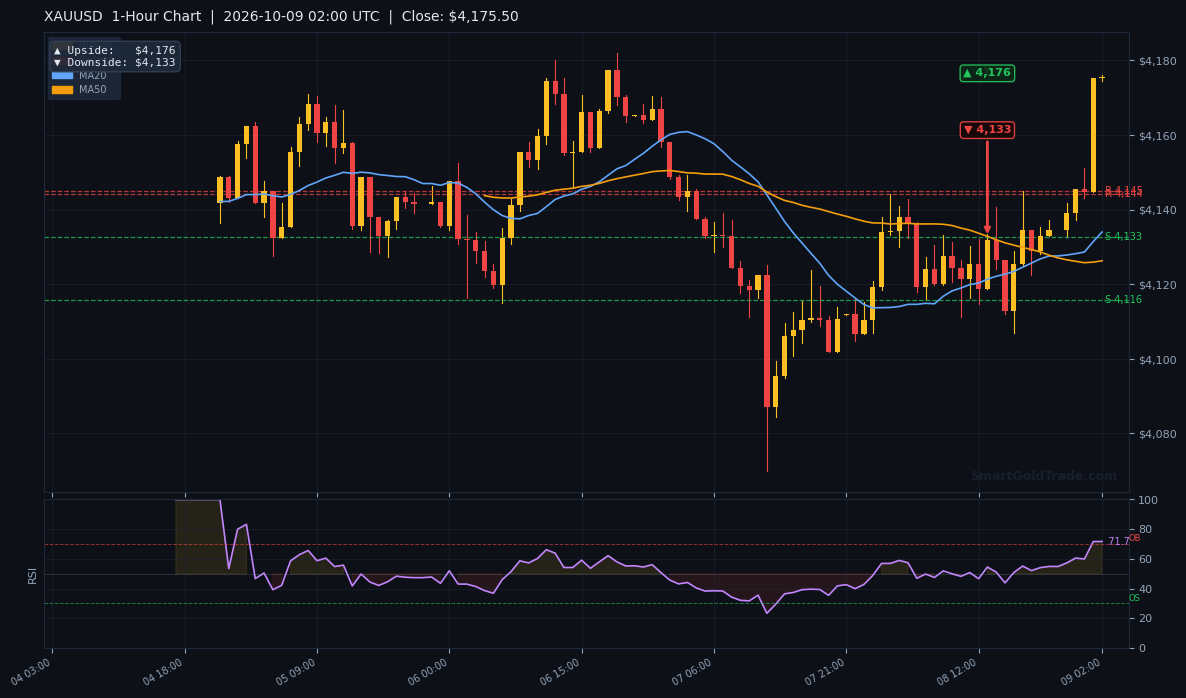
RSI(14) at 71.4 is firmly in overbought territory — a warning that upside is stretched. Stochastic at 93.6/87.7 reinforces exhaustion risk. MACD at 7.28 with a positive histogram of +4.42 still favors bulls, but the gap between momentum and price is widening.
Translation: rallies toward $4,184 may meet sellers. Dips toward $4,165 are more likely to attract buyers than chase-breakouts above $4,180.
Key Price Levels
Immediate support sits at $4,165.69 (S1), with deeper support at $4,150.18 (S2). Resistance is stacked at $4,179.69 (R1) and $4,184.39 (R2). The Bollinger midline at $4,129.71 and lower band at $4,103.19 mark the wider downside risk zone.
| Timeframe | Upside Target | Downside Target |
|---|---|---|
| Daily | $4,510 | $4,070 |
| 4-Hour | $4,194 | $4,137 |
| 1-Hour | $4,176 | $4,133 |
Fundamental Drivers
Two events are steering the gold price this week. First, Wednesday's Fed minutes showed policymakers united behind September's hike, with most seeing another increase appropriate by year-end. That keeps the hawkish drumbeat alive.
Second, Thursday's jobless claims came in at 197K, below the 200K forecast — a resilient labor market that gives the Fed room to stay tight. Waller's "flexibility" comment is the only dovish thread, and it's thin.
Key Event to Watch
The next major catalyst is December's FOMC decision, now priced at 81.3% probability of a hike. Until then, traders will parse every Fed speaker for hints on the October pause. A confirmed pause would weaken the dollar and lift gold toward $4,194 and beyond. A hawkish surprise would test $4,165 and possibly $4,150.
For traders wanting to automate entries around these catalysts, news event trading protection can pause positions during high-impact releases.
Devil's Advocate
The bullish case rests on thin volume and a dovish Waller headline. But RSI at 71.4 and Stochastics above 90 scream exhaustion. If price fails to hold $4,165.69 (S1), a swift slide toward $4,150.18 (S2) is likely.
A daily close below $4,150 would flip the intraday bias bearish and open $4,137 (H4 downside target). The bull thesis dies if $4,133 breaks — that would invalidate the 1-hour structure entirely.
Trading Strategy for Asian Session
Given overbought momentum and thin liquidity, the higher-probability play is buying dips, not breakouts. Look for entries near $4,165.69 (S1) with a stop at $4,150.18 (S2) — roughly one ATR of $14.91 below entry.
First target: $4,179.69 (R1). Second target: $4,184.39 (R2). If R2 breaks with volume, trail toward the 4-hour upside target of $4,194.
Risk-reward on this setup is roughly 1:1.5 — acceptable but not exceptional. Position size conservatively. Avoid shorting into support at $4,165 unless a clean hourly close below it prints.
For traders building long-term exposure to gold outside leveraged products, physical gold products offer a tangible alternative to spot speculation.
Key Takeaways
- Gold price holds $4,175.21, up 1.04% today, above the EMA200 at $4,165.50.
- RSI(14) at 71.4 signals overbought conditions — pullback risk is elevated.
- Immediate resistance at $4,179.69 (R1) and $4,184.39 (R2).
- Key support at $4,165.69 (S1); a break opens $4,150.18 (S2).
- ATR(14) of $14.91 suggests a contained session range near 0.36%.
- December Fed hike odds at 81.3% keep the medium-term bias cautious.
Conclusion
The gold price bias for this Asian session is cautiously bullish above $4,165.50, but overbought momentum argues against aggressive longs. The cleanest setup is a dip-buy near $4,165.69 targeting $4,179.69 to $4,184.39.
Watch the VWAP at $4,153.81 — a sustained break below it would shift the intraday bias bearish. Volume will remain thin until London, so patience is the edge. Let the levels come to you.
Frequently Asked Questions
- What is the gold price right now?
- Gold is trading at $4,175.21 during the Asian session, up 1.04% on the day.
- Is gold overbought?
- Yes. RSI(14) at 71.4 and Stochastic at 93.6/87.7 both signal overbought conditions, raising pullback risk toward $4,165.69.
- What are the key resistance levels for gold today?
- Immediate resistance sits at $4,179.69 (R1) and $4,184.39 (R2). A break above R2 opens the 4-hour target of $4,194.
- What support should traders watch?
- The first support is $4,165.69 (S1), followed by $4,150.18 (S2). A daily close below $4,150 would flip the bias bearish.
- How does the Fed affect the gold price this week?
- December hike odds at 81.3% keep yields elevated, capping gold's upside. A confirmed October pause would weaken the dollar and lift gold toward $4,194.
Trading Gold (XAU/USD) carries significant risk of loss and is not suitable for all investors. This content is for informational purposes only and does not constitute financial advice. Always conduct your own research and trade responsibly.