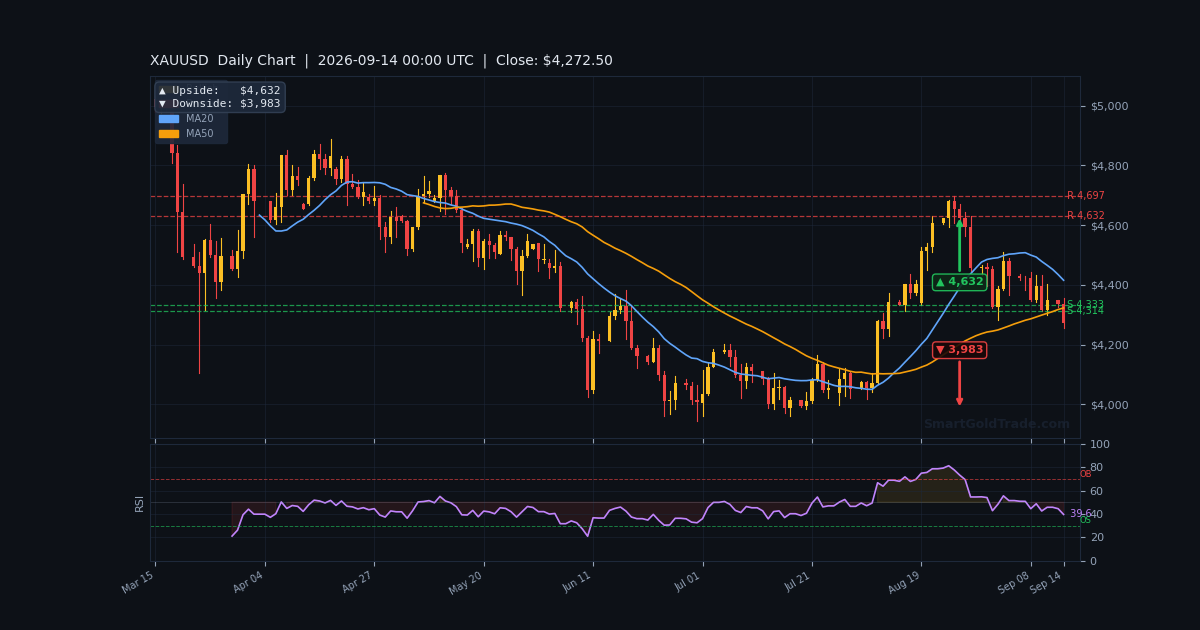
The gold price is trading at $4,271.27 in the American Session, down 1.56% on the day, and the market is at a genuine inflection point. Last week's US CPI report showed core inflation rising 0.3% month-over-month, and that single number has reshaped the entire rate picture ahead of Wednesday's Federal Reserve decision. With the RSI(14) sitting at 30.0 — squarely oversold — gold is now caught between a hawkish macro backdrop and a short-term technical bounce signal. This session will decide whether the metal finds a floor here or extends its slide toward the yearly support zone that FOREX.com flagged this morning.
Gold Market Overview
Macro Context
The Dollar Index (DXY) is trading near 99.57, its highest level since September 3, and the 10-year Treasury yield hovers around 4.95% — close to last week's three-year high of 4.99%. Both are direct headwinds for the gold price.
Markets now price an 86.5% probability of a 25-basis-point rate hike at Wednesday's FOMC meeting, up from roughly 59% a week ago. Commerzbank expects the Fed Funds target range to rise to 3.75–4.00%.
Geopolitical risk has not helped gold the way it traditionally would. Houthi forces captured strategic islands near the Bab el-Mandeb shipping route, and Saudi Arabia shut its East-West pipeline after a drone attack. WTI crude trades near $99.00, up over 15% this month — yet gold has decoupled from its safe-haven role, with rate expectations now driving price action.
Session Outlook
The American Session brings the deepest liquidity of the day, and with ADX at 24.1 the market is ranging rather than trending. That means sharp intraday reversals are likely around the key levels.
The ATR(14) of $19.85 suggests an expected hourly range near 0.47% of price. Watch $4,247 on the downside and $4,285 on the upside as the session's first reaction points.
Technical Analysis
Moving Average Structure
Price at $4,271.27 sits below the EMA20 at $4,318.98, the EMA50 at $4,341.37, and the EMA200 at $4,392.83. That stacked alignment confirms a bearish structure on the H1 timeframe.
The VWAP at $4,316.27 reinforces the same message — intraday positioning is heavily weighted to the sell side. On the daily chart, the EMA200 at $4,319.79 has also flipped to resistance, a level bulls must reclaim to shift momentum.
RSI and Momentum
The RSI(14) reads 30.0 — the textbook oversold threshold — while the Stochastic prints 12.9/13.0, deep in oversold territory. Both signal that selling pressure is stretched and a bounce is technically overdue.
However, MACD at -17.78 with a histogram of -6.03 shows bearish momentum is still expanding, not fading. Oversold conditions in a strong downtrend can persist, so treat any bounce as a countertrend move until the EMAs are reclaimed.
Key Price Levels
Immediate support rests at S1 $4,247.24, with S2 $4,229.88 as the deeper floor. Resistance begins at R1 $4,284.89 and extends to R2 $4,304.31.
The Bollinger Bands span $4,276.15 (lower), $4,326.80 (mid), and $4,377.45 (upper). Price is pinned to the lower band, another oversold tell.
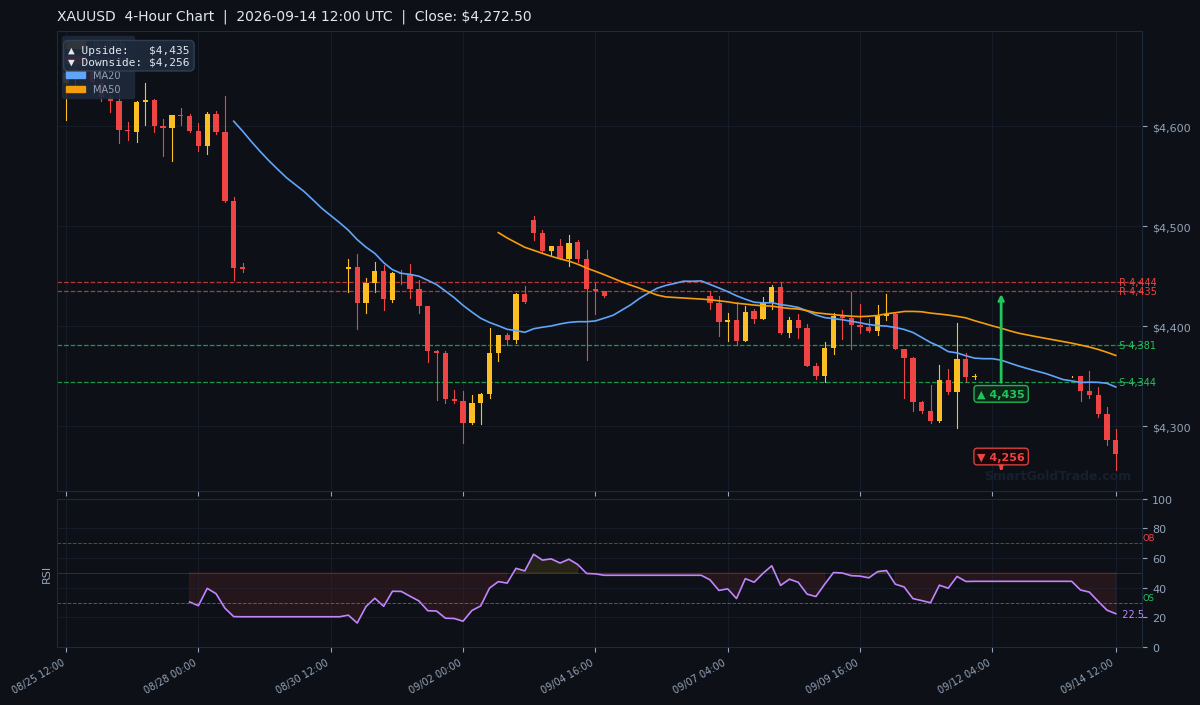
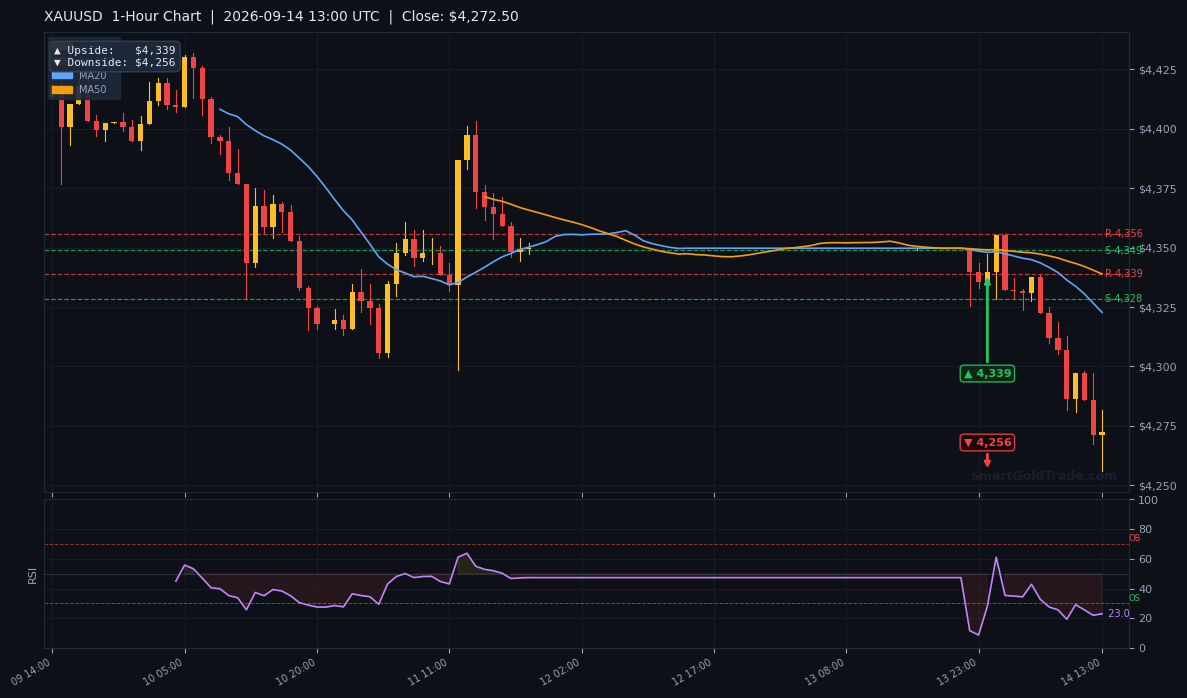
| Timeframe | Upside Target | Downside Target |
|---|---|---|
| Daily | $4,632 | $3,983 |
| 4-Hour | $4,435 | $4,256 |
| 1-Hour | $4,339 | $4,256 |
Fundamental Drivers
Friday's CPI report is the dominant force. Headline inflation rose 0.4% MoM in August, accelerating from 0.1% in July, while core CPI climbed 0.3% — its fastest pace in four months. That data cemented the case for a quarter-point hike this week.
The stronger Dollar and elevated Treasury yields are the twin weights on gold. Because the metal pays no interest, rising yields raise its opportunity cost. MUFG notes the Dollar has strengthened only modestly, but policy credibility risks and energy-driven inflation could cap further upside.
Key Event to Watch
Wednesday's FOMC decision and Chair Kevin Warsh's press conference are the week's defining events. The market has fully priced a 25bp hike, so the real question is whether Warsh frames it as a one-off adjustment or the start of a broader tightening cycle. A hawkish tone would pressure the gold price toward $4,229; a measured, data-dependent message could spark a relief rally toward $4,304.
Devil's Advocate
The bearish case rests on the Fed and the Dollar. But the oversold RSI at 30.0 and Stochastic near 13 argue that the easy selling is done. If price reclaims R1 $4,284.89 and holds above the VWAP at $4,316.27, the bearish thesis weakens fast.
A daily close above the EMA200 at $4,319.79 would flip the structure neutral and open the path toward R2 $4,304.31 and beyond. Conversely, a clean break below S2 $4,229.88 would confirm the next leg lower and invalidate any bounce scenario.
Trading Strategy for American Session
With ADX at 24.1 signaling a ranging market, the highest-probability approach is to trade the edges rather than the middle. The ATR of $19.85 gives a realistic stop-distance framework for intraday positioning.
Long setup: An entry zone between $4,247.24 (S1) and $4,255 offers a tactical bounce trade. Place the stop below S2 $4,229.88 — roughly $20–25 of risk, in line with ATR. First target is R1 $4,284.89, with a secondary target at R2 $4,304.31.
Short setup: If price rallies into $4,284.89 and rejects, a short entry with a stop above $4,304.31 targets $4,247.24 and then $4,229.88. The 1-hour chart's downside arrow at $4,256 marks the first magnet.
For traders who prefer to follow institutional-grade setups rather than manage entries manually, real-time trading alerts can complement this level-based approach during the volatile FOMC run-up.
Key Takeaways
- Gold price trades at $4,271.27, down 1.56% today and below all key EMAs.
- RSI(14) at 30.0 and Stochastic at 13 signal oversold bounce potential.
- Immediate support at S1 $4,247.24; deeper floor at S2 $4,229.88.
- Resistance at R1 $4,284.89 and R2 $4,304.31 caps upside.
- 86.5% Fed hike odds for Wednesday keep the Dollar and yields elevated.
- ATR(14) of $19.85 defines the expected hourly range near 0.47%.
Conclusion
The gold price enters the American Session at $4,271.27 with a bearish structure but an oversold oscillator — a combination that favors tactical bounces within a dominant downtrend. The EMA200 at $4,392.83 and the VWAP at $4,316.27 remain the levels bulls must reclaim to change the narrative.
Until then, the bias stays cautiously bearish, with $4,247 as the pivotal line. A break below $4,229.88 opens the door to the yearly support zone; a reclaim of $4,304 would shift momentum. For those building longer-term exposure to the metal, buy certified gold coins and bars remains a tangible way to hold value through rate-driven volatility.
Frequently Asked Questions
- Is the gold price oversold right now?
- Yes. The RSI(14) at 30.0 and Stochastic at 12.9/13.0 place gold firmly in oversold territory on the H1 chart, though MACD at -17.78 shows momentum is still negative.
- What is the key support level for gold today?
- Immediate support sits at S1 $4,247.24, with the deeper floor at S2 $4,229.88. A break below $4,229.88 would target the yearly support zone.
- What resistance must gold break to turn bullish?
- Bulls need a close above R1 $4,284.89 and ideally above the VWAP at $4,316.27 to neutralise the bearish structure.
- How will Wednesday's Fed decision affect the gold price?
- Markets price an 86.5% chance of a 25bp hike. A hawkish Warsh press conference could push gold toward $4,229.88, while a data-dependent tone could lift it toward $4,304.31.
Trading Gold (XAU/USD) carries significant risk of loss and is not suitable for all investors. This content is for informational purposes only and does not constitute financial advice. Always conduct your own research and trade responsibly.