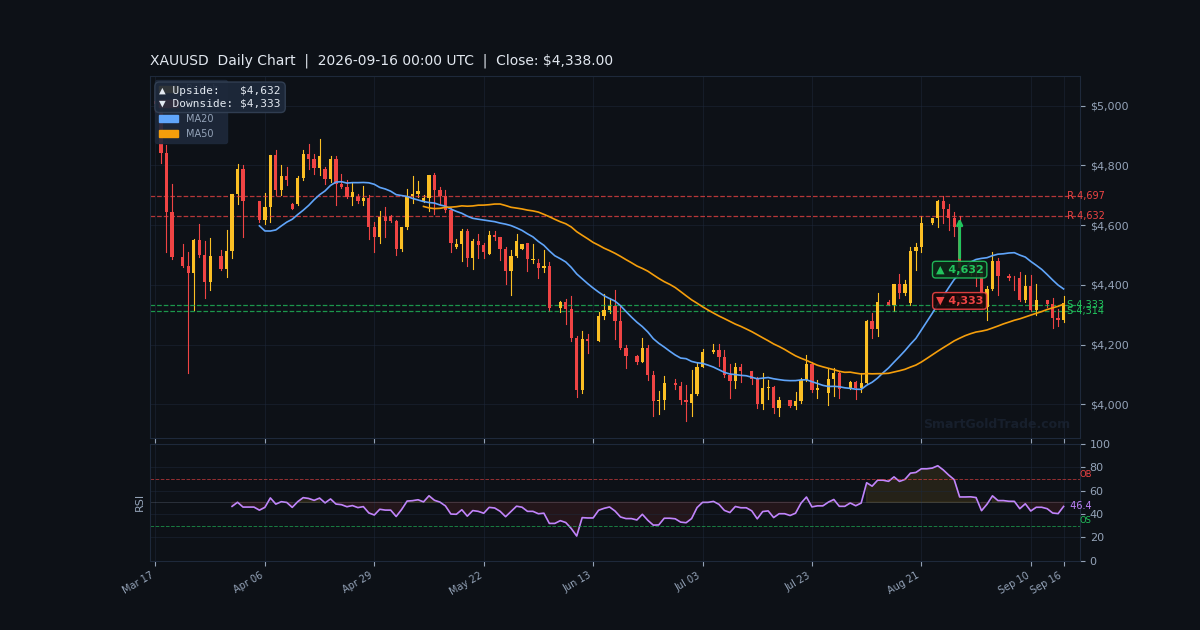
The gold price is holding at $4,337.10 in the American Session, pressing against the $4,338.80 resistance that has capped every bounce since Monday's slide to a one-month low. After a bruising week that dragged the metal below its 200-period average on the hourly chart, buyers have quietly stepped back in — and the tape now looks far more constructive than it did 48 hours ago.
Today's recovery follows Tuesday's 10-year Treasury yield spike to 5.04%, its highest close since 2007, and a fresh surge in WTI crude above $105 on Middle East supply risk. Those two forces pulled gold to $4,261 before buyers absorbed the selling. With the Fed's rate decision due at 18:00 GMT, positioning — not conviction — is driving this bounce.
This session is about one question: can bulls reclaim $4,338.80 before Powell's successor Kevin Warsh steps to the podium? The next few hours will decide whether this is a genuine reversal or just a pause before the next leg lower.
Gold Market Overview
Macro Context
The Dollar Index is pinned near two-week highs around 99.65, unchanged on the day, while the 10-year Treasury yield sits at 4.99% after Tuesday's 5.04% print. That combination is normally toxic for the gold price, yet XAU/USD is up 1.22% on the day — a sign that sellers are exhausted and the market has already priced the hawkish Fed outcome.
Markets now assign a 92.5% probability to a 25-basis-point hike to 3.75%–4.00%, which would break the Fed's five-meeting hold streak. ING strategists describe it as a "consensus 25bp" move and warn that a surprise hold would deliver a big blow to the Dollar. Oil above $100 remains the wildcard — it keeps inflation risk alive and complicates the Fed's path back to 2%.
Session Outlook
American Session liquidity will concentrate in the 18:00 GMT release and the 18:30 GMT press conference. Expect the first 30 minutes to produce erratic, headline-driven swings as algos chase the dot plot. The ATR(14) of $14.57 suggests a normal hourly range near 0.34%, but FOMC days routinely triple that.
Watch the $4,285.50 support on any knee-jerk dip — it has held twice today. Above, $4,338.80 is the trigger for momentum buyers.
Technical Analysis
Moving Average Structure
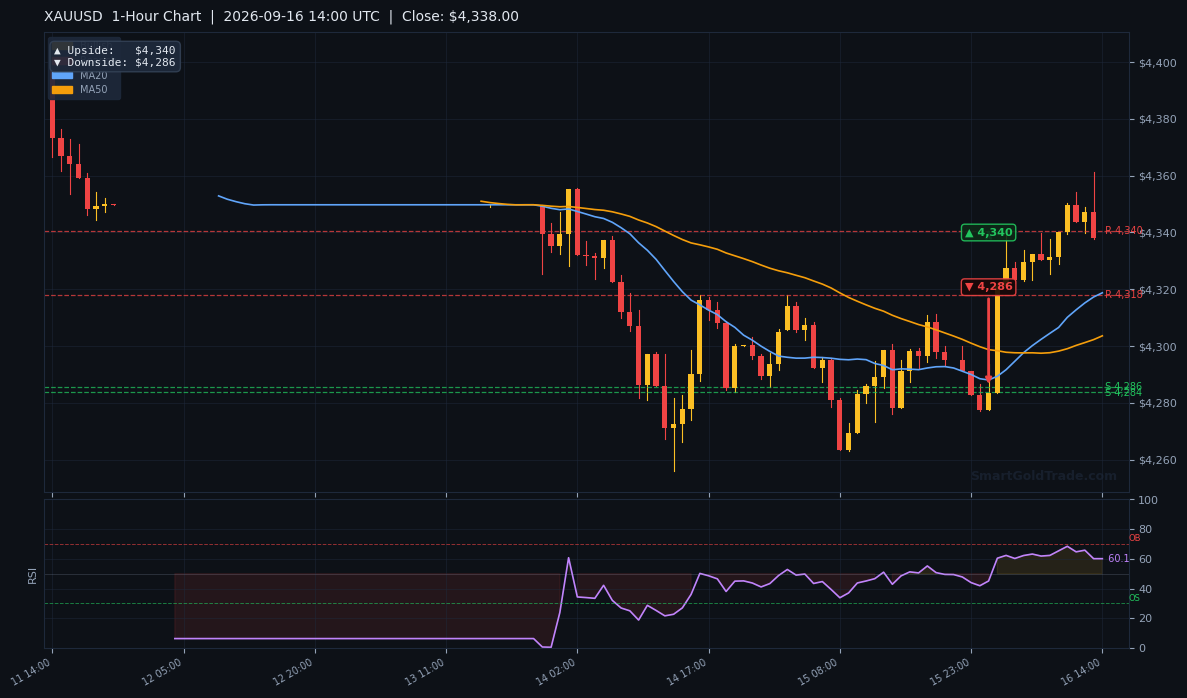
The hourly chart shows price at $4,337.10 trading above the MA20 at $4,318.66 and the MA50 at $4,303.54 — a short-term bullish alignment. However, the MA200 at $4,359.80 sits overhead, keeping the broader structure bearish until reclaimed.
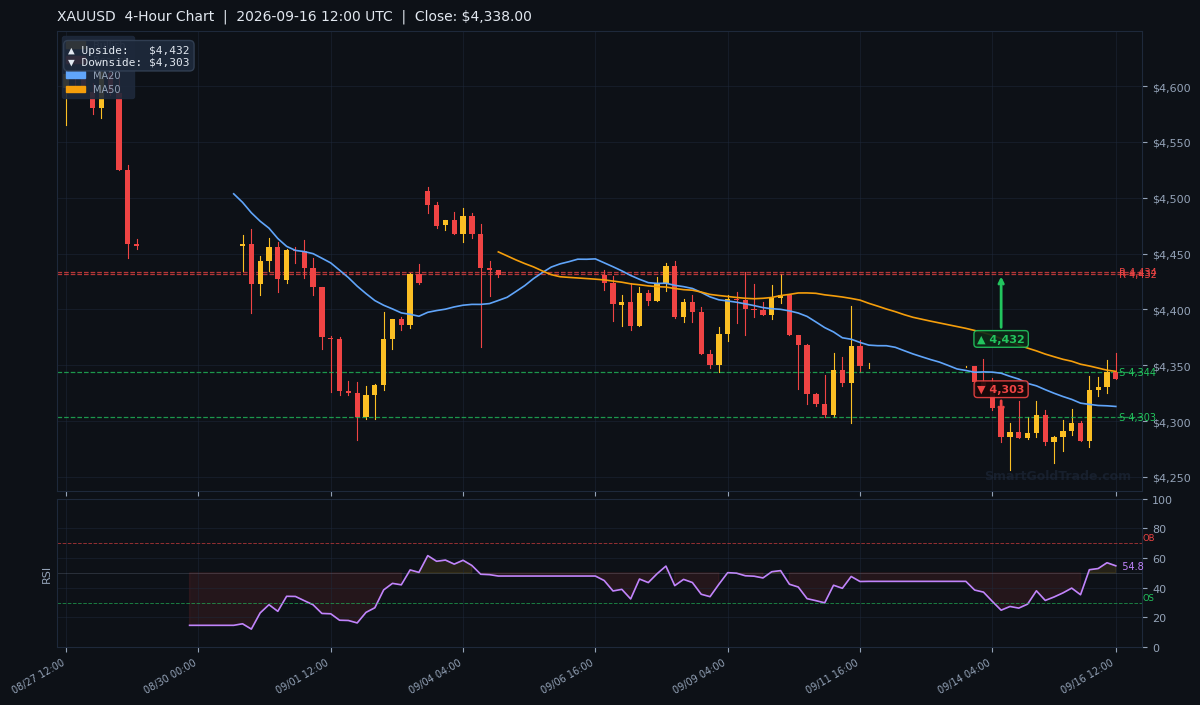
On the H4 timeframe, the close at $4,337.10 sits below the H4 MA200 at $4,364.59, while the Daily close at $4,337.10 holds above the Daily MA200 at $4,320.10. That split tells the story: the daily trend remains intact, but the intraday picture is a recovery inside a corrective range.
RSI and Momentum
RSI(14) reads 59.6 — neutral, but leaning toward the upper half of the range. The Stochastic at 92.1/92.7 is deeply overbought on the hourly, which argues against chasing longs at current levels. MACD at 13.10 with a histogram of +4.28 confirms building upside momentum.
ADX at 27.1 signals a strong trend is in place. Combined with the overbought Stochastic, the cleanest play is a pullback entry rather than a breakout chase.
Key Price Levels
Immediate resistance sits at $4,338.80 (R1), followed by $4,340.50 (R2). To the downside, $4,285.50 (S1) is the first line of defense, with $4,283.60 (S2) below. The VWAP at $4,322.55 reinforces the S2 zone as a high-probability demand area.
Bollinger Bands at $4,360.26 / $4,314.66 / $4,269.07 frame the session. A push through the upper band would open $4,340.50, while a loss of the middle band at $4,314.66 would shift the bias back to bears.
| Timeframe | Upside Target | Downside Target |
|---|---|---|
| Daily | $4,632 | $4,333 |
| 4-Hour | $4,432 | $4,303 |
| 1-Hour | $4,340 | $4,286 |
Fundamental Drivers
The Fed's decision lands at 18:00 GMT with a 92.5% probability of a 25bp hike. This would be the first increase since July 2023 and lifts the target range to 3.75%–4.00%. The move reflects inflation pressure from the Middle East energy shock, with Brent back above $107 and WTI holding near $103.
ING strategists caution that a surprise hold would deliver a "big blow to the Dollar" through dovish front-end repricing and a likely selloff in the back end. Their view also argues for a hawkish message — a dovish hike may not satisfy bond investors demanding discipline with 89bp of tightening already priced by June.
Tuesday's inflation read at 3.1% was softer than feared, but energy costs are set to push higher. That keeps the Fed's task difficult and gives gold a structural bid despite the rate-hike backdrop.
Key Event to Watch
The FOMC statement, dot plot, and Warsh's press conference are the single most important catalysts this week. A hawkish dot plot showing two more hikes by year-end would pressure gold toward $4,283.60. A softer tone or any hint of a pause would open $4,340.50 and potentially the H4 target at $4,432.
Devil's Advocate
The bullish case rests on a fragile foundation. The hourly Stochastic at 92.1 is screaming overbought, and the MA200 at $4,359.80 still caps the structure. If the Fed delivers a hawkish hike with an upgraded dot plot, this bounce could unravel fast.
A daily close below $4,285.50 would invalidate the recovery and shift focus to $4,283.60. A break of that level opens the 1-hour downside target at $4,286 and the 4-hour target at $4,303. Bulls need a decisive close above $4,338.80 to keep control.
Trading Strategy for American Session
Two setups frame the session. For longs, wait for a pullback into the $4,285.50–$4,283.60 demand zone with a stop below $4,270 (roughly 1.5x the $14.57 ATR). Target $4,338.80 first, then $4,340.50.
For aggressive breakout traders, a confirmed hourly close above $4,338.80 opens a run at $4,340.50 and the H4 upside target at $4,432. Stop below $4,285 keeps risk tight at roughly 1x ATR.
Avoid holding large positions into the 18:00 GMT release unless you accept gap risk. The ATR of $14.57 is a guide for normal conditions — FOMC volatility typically expands ranges by 2–3x. Position sizing should reflect that reality.
For traders who prefer a rules-based approach, professional gold trading signals can help frame entries around the Fed release without chasing headlines.
Key Takeaways
- Gold price holds $4,337.10, up 1.22% on the day but still below the hourly MA200 at $4,359.80.
- Immediate resistance at $4,338.80; a clean break opens $4,340.50.
- Support cluster at $4,285.50 and $4,283.60, reinforced by VWAP at $4,322.55.
- RSI at 59.6 is neutral, but Stochastic at 92.1 flags near-term overbought risk.
- Fed decision at 18:00 GMT with 92.5% odds of a 25bp hike — the session's dominant catalyst.
- ATR of $14.57 sets a normal hourly range near 0.34%; FOMC days typically exceed it.
Conclusion
The gold price is grinding higher into the Fed decision, but the bounce is running into the $4,338.80 wall at exactly the wrong moment. Bulls have momentum on their side — MACD is expanding, price is above the short-term MAs — yet the overbought Stochastic and the MA200 overhead argue for patience.
For those building longer-term exposure to the metal, options like purchase physical gold remain a viable hedge against the inflation pressures the Fed is trying to fight. Tonight's verdict will decide whether $4,340.50 or $4,283.60 is tested first. Trade the reaction, not the prediction.
Frequently Asked Questions
- What is the gold price right now?
- Gold is trading at $4,337.10 in the American Session, up 1.22% on the day and holding above the MA20 at $4,318.66.
- What are the key resistance levels for gold today?
- Immediate resistance is $4,338.80, followed by $4,340.50. A clean break above $4,338.80 opens the H4 upside target at $4,432.
- What happens to gold if the Fed hikes rates tonight?
- A 25bp hike is 92.5% priced in, so the reaction depends on the dot plot. A hawkish message could push gold toward $4,283.60, while a dovish tone opens $4,340.50.
- Where is the best entry for a gold long today?
- The highest-probability long entry sits in the $4,285.50–$4,283.60 demand zone with a stop below $4,270 and targets at $4,338.80 and $4,340.50.
- Is gold still in a bullish trend?
- The Daily close at $4,337.10 holds above the Daily MA200 at $4,320.10, keeping the longer-term trend intact. The hourly structure remains corrective below $4,359.80.
Trading Gold (XAU/USD) carries significant risk of loss and is not suitable for all investors. This content is for informational purposes only and does not constitute financial advice. Always conduct your own research and trade responsibly.