The gold price is holding $4,368.96 into the American Session, up 0.59% on the day, as bulls try to build on last week's post-Fed recovery. The metal is trading just above the VWAP at $4,370.67 and above the EMA200 at $4,352.98 — a structure that keeps the intraday bias constructive despite a hawkish Fed backdrop.
Wednesday's FOMC delivered a 25bp hike to 3.75–4.00%, with Chair Kevin Warsh calling policy "hard to describe as restrictive." Markets now price a 53.1% chance of another hike in October, up from 44% a day earlier. That repricing is the single biggest headwind for gold right now.
Where does that leave XAU/USD for the rest of today? The answer sits between $4,342 and $4,382 — and one of those levels breaks first.
Gold Market Overview
Macro Context
The US Dollar index is firm after the Fed's unanimous vote and upward-revised dot plot. Nordea strategists now expect two additional hikes, arguing the economy remains resilient and inflation sticky. That view is being priced into the curve, and it is capping gold's upside.
Treasury yields stabilised post-FOMC, which is telling. Traders are relieved the Fed is acting on price stability rather than offering platitudes. For gold, that means the opportunity cost of holding bullion stays elevated — a structural drag.
Geopolitics is the offset. Trump's meeting with Gulf leaders to discuss the Iran war is keeping a safe-haven bid under the metal. Oil is firm, and that combination historically supports gold even when real yields rise.
Session Outlook
The American Session brings the deepest liquidity of the day, and with ATR(14) at $18.00, an hourly range of roughly 0.41% is the baseline. Expect $4,350–$4,385 as the working band unless a headline forces a breakout.
The key trigger is the Iran meeting headlines. Any escalation language will push gold through $4,382 toward the 4-hour target at $4,400. A de-escalation tone flips the script toward $4,342.
Technical Analysis
Moving Average Structure
Price sits above all three key moving averages on the H1 chart: EMA20 at $4,365.90, EMA50 at $4,345.73, and EMA200 at $4,352.98. That stacking is a textbook bull structure and explains why dips keep getting bought.
The H4 EMA200 at $4,361.76 and the D1 EMA200 at $4,319.97 both sit below price, reinforcing the higher-timeframe bullish tilt. As long as $4,352.98 holds on a closing basis, the path of least resistance remains up.
RSI and Momentum
RSI(14) on the H1 is 54.2 — neutral, with room to run before overbought. Stoch reads 66.1/70.5, also neutral-to-firm. MACD at 13.03 with a histogram of -0.57 shows momentum flattening, not reversing.
Translation: no exhaustion signal yet. The market can push higher without triggering a mean-reversion alarm, which supports buying dips rather than chasing breakouts.
Key Price Levels
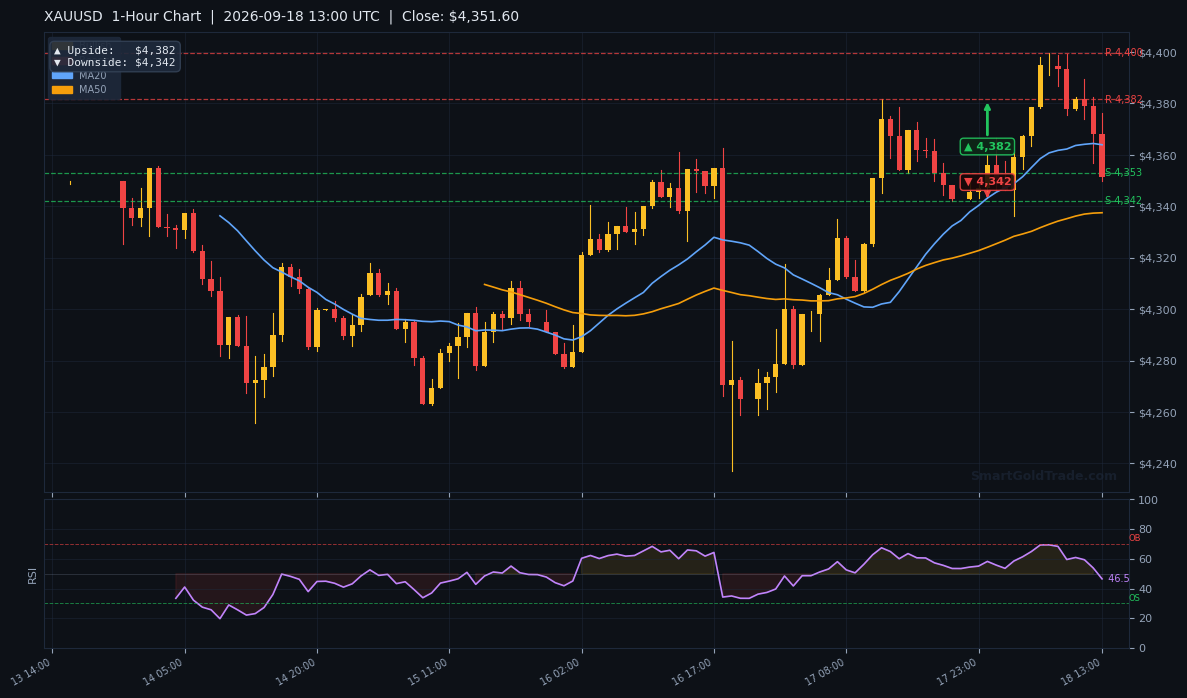
Immediate resistance is R1 $4,371.84, then R2 $4,381.07 — which is also the prior day high and the 1-hour chart's upside pivot at $4,382. Support sits at S1 $4,367.29 and S2 $4,365.57, with the 1-hour downside pivot at $4,342 as the real line in the sand.
| Timeframe | Upside Target | Downside Target |
|---|---|---|
| 1-Hour | $4,382 | $4,342 |
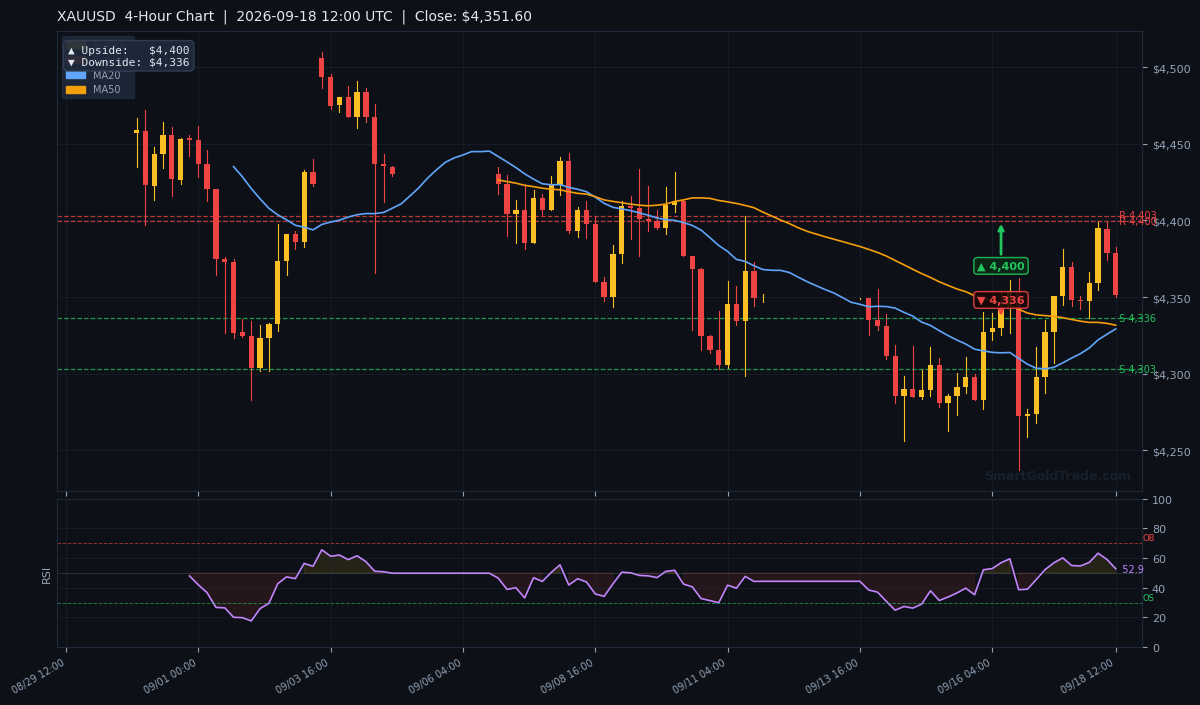
| 4-Hour | $4,400 | $4,336 |
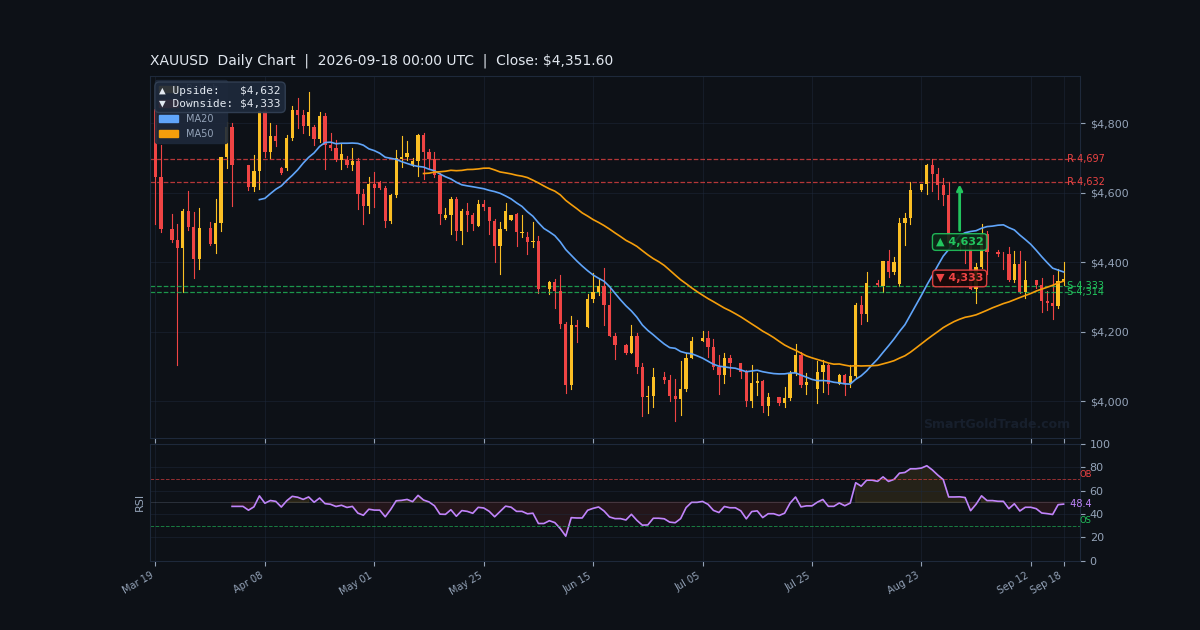
| Daily | $4,632 | $4,333 |
Fundamental Drivers
The Fed story dominates. Wednesday's hike was unanimous, the median dot now implies one more increase this year and none in 2027, and Warsh explicitly said policy is "hard to describe as restrictive." That is a hawkish package, and the dollar rallied hard off it — EUR/USD broke below 1.15 for the first time since late July.
The second driver is geopolitical. Trump's meeting with Gulf leaders over the Iran war is live today. Gold has already extended gains on this headline, and any escalation in rhetoric will add to the safe-haven premium. Oil is firm alongside it.
The tension between a hawkish Fed (bearish gold) and Middle East risk (bullish gold) is exactly why price is compressing between $4,342 and $4,382 rather than trending cleanly.
Key Event to Watch
The Iran meeting outcome is the single most important catalyst this week. A hardline read pushes gold toward $4,400. A diplomatic breakthrough pulls it back to $4,342. Traders running automated systems through this headline risk should consider a news event trading protection layer to pause exposure during the spike.
Devil's Advocate
The bullish case rests entirely on $4,352.98 holding. A clean H1 close below the EMA200 would invalidate the structure and open S2 $4,365.57 as the first crack, then $4,342 as the real target.
If October hike odds push above 60%, the dollar leg higher will likely overwhelm the geopolitical bid. That is the scenario that flips this trade from buy-the-dip to sell-the-rally. Watch the CME FedWatch tool intraday — it moved 9 points in 24 hours, and it can move again.
Trading Strategy for American Session
The primary setup is a long from the $4,365–$4,367 zone (S2/S1 confluence), with a stop at $4,347 — roughly one ATR below entry. First target is R1 $4,371.84, second is R2 $4,381.07, and the stretch is the 4-hour pivot at $4,400.
Risk-reward on that structure is approximately 1:2 if you scale out at R2. If price instead breaks and closes below $4,365.57, stand aside — the next real demand is $4,342, and chasing shorts into that level is low-quality.
For traders who prefer to mirror proven positioning rather than execute manually, copy trading offers a way to follow gold specialists through the session without watching every tick. Position sizing should stay conservative given the headline risk from the Iran meeting.
Key Takeaways
- Gold price trades at $4,368.96, up 0.59% today and above all key H1 moving averages.
- Bull structure intact while $4,352.98 (EMA200) holds on a closing basis.
- Immediate resistance at $4,371.84, then $4,381.07 — the 1-hour upside pivot.
- Downside invalidation sits at $4,342; a break opens the 4-hour target at $4,336.
- ATR of $18.00 implies a 0.41% hourly range — expect $4,350–$4,385 as the working band.
- Fed hike odds for October at 53.1% are the key macro swing factor for DXY and gold.
Conclusion
The gold price bias for the American Session is cautiously bullish while $4,352.98 holds, with $4,382 as the immediate hurdle and $4,400 as the stretch target. The hawkish Fed caps enthusiasm, but the Iran meeting headlines and firm oil are providing enough of a safe-haven bid to keep dips supported.
Watch the CME FedWatch odds and the Iran headlines in equal measure — those two forces are pulling in opposite directions and will decide which pivot breaks first. A close above $4,382 opens the door to $4,400. A close below $4,365.57 shifts focus to $4,342. Size positions accordingly and let the levels do the work.
Frequently Asked Questions
- What is the gold price right now?
- Gold (XAU/USD) is trading at $4,368.96 in the American Session, up 0.59% on the day and above the H1 EMA200 at $4,352.98.
- What are the key resistance levels for gold today?
- Immediate resistance is $4,371.84 (R1), followed by $4,381.07 (R2 and prior day high). A break above $4,382 targets the 4-hour pivot at $4,400.
- What would invalidate the bullish gold setup?
- A clean H1 close below the EMA200 at $4,352.98 would weaken the structure. The real invalidation is $4,342, which opens the 4-hour downside target at $4,336.
- How is the Fed affecting the gold price today?
- Wednesday's 25bp hike to 3.75–4.00% and Warsh's hawkish comments pushed October hike odds to 53.1%, supporting the dollar and capping gold's upside. This is the main headwind against the bullish technical structure.
- What is the expected trading range for gold this session?
- With ATR(14) at $18.00 (0.41% of price), the expected hourly range is roughly $18. A realistic session band is $4,350–$4,385 unless the Iran meeting headlines force a breakout.
Trading Gold (XAU/USD) carries significant risk of loss and is not suitable for all investors. This content is for informational purposes only and does not constitute financial advice. Always conduct your own research and trade responsibly.