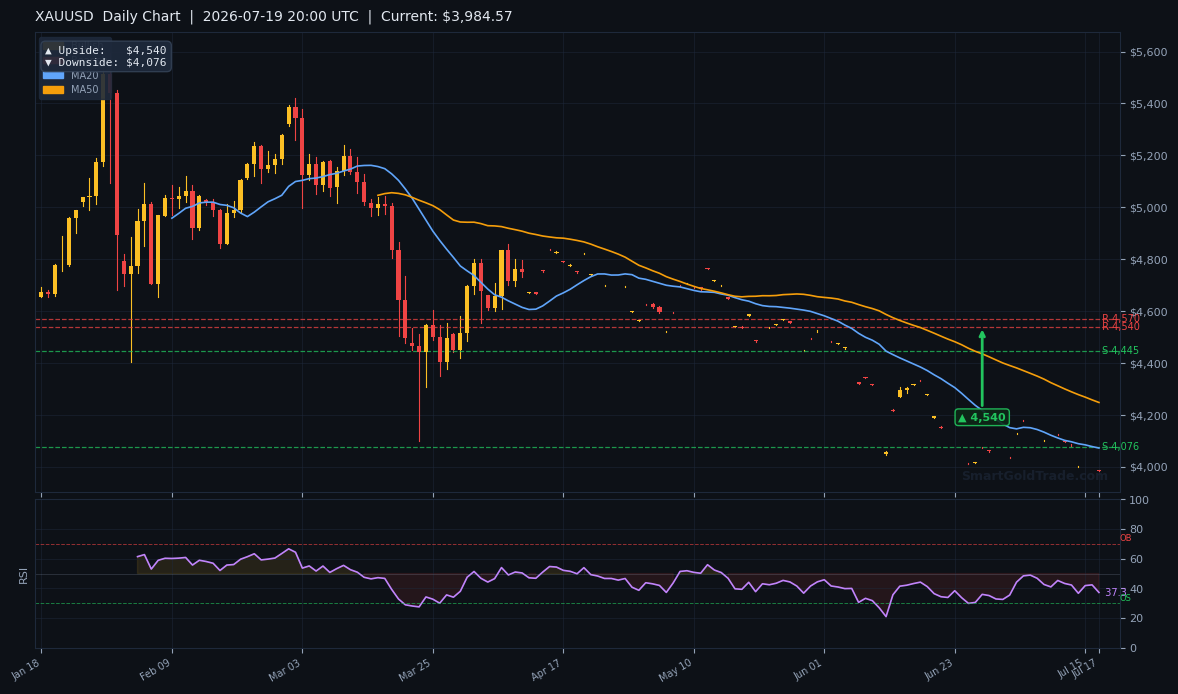
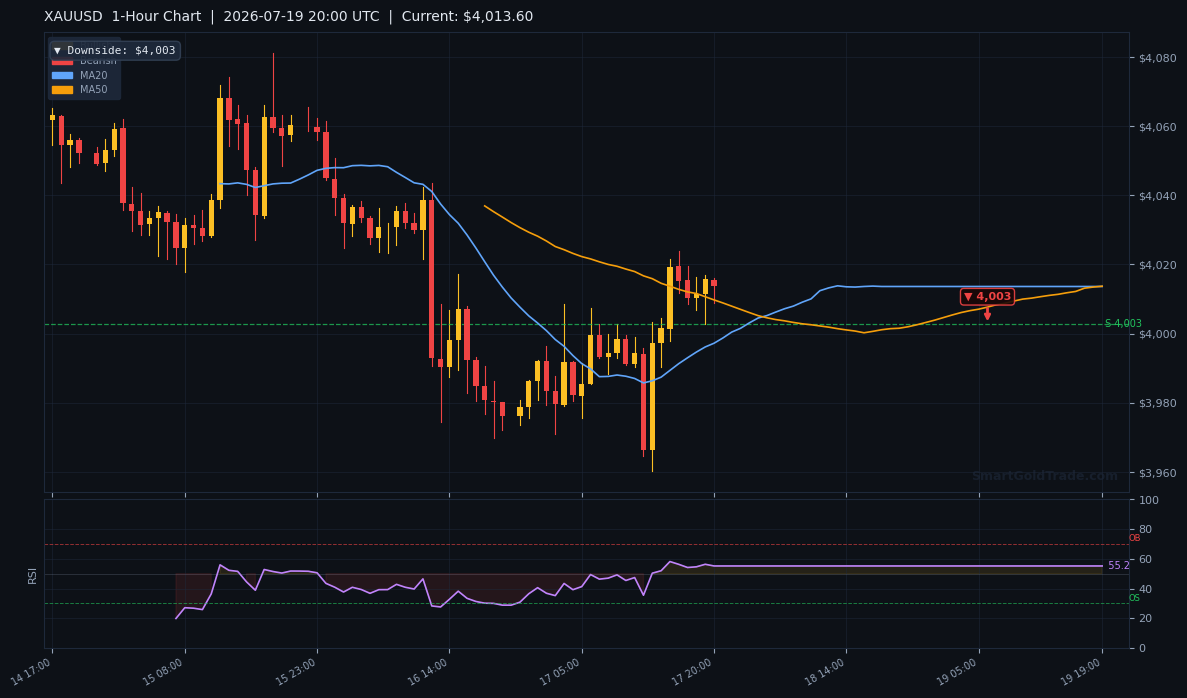
Gold price is trading at $4,013.47 during the American session on July 19, 2026, and the pressure is building rapidly. After the initial euphoria that sent XAU/USD above $4,170 on the back of the June nonfarm payrolls report, the entire rally has evaporated. The post‑jobs optimism that momentarily cooled rate‑hike anxiety has been replaced by a steady wave of selling, pulling gold below every major moving average on the 4‑hour chart. Bears are now targeting the $4,003 support level, a line in the sand that matches the 1‑hour chart’s pivot downside. How this level holds during the high‑liquidity New York window will set the tone for the rest of the week.
Gold Price Market Overview
Macro Context
The macro landscape has shifted dramatically in the last 48 hours. The US Dollar Index remains elevated as traders reassess the Federal Reserve’s next move after the June employment data beat expectations. Yields on the 10‑year Treasury note are holding above 4.30%, pressuring non‑yielding assets. Although the initial reaction to the jobs report last week was a gold price spike to $4,174, the follow‑through was weak. That failed breakout now looks like a classic bull trap, with the DXY reclaiming ground above 104.50. Geopolitical risk, notably the ongoing Iran tensions, has not escalated enough to provide a sustained safe‑haven bid, leaving gold vulnerable to dollar strength and real yield repricing.
Session Outlook
The American session is where direction gets decided. With New York desks fully staffed and institutional order flow driving price, the reaction around the $4,003 handle will be critical. A clean break below that level would likely trigger stop‑losses from late longs and open the door to $3,980. Conversely, a bounce that reclaims the MA20 at $4,025.26 could offer a short‑lived respite. Expect intraday volatility to align with the ATR(14) reading of $12.14, so sudden moves of $10–$15 in a single 4‑hour candle are entirely possible for the gold price. Liquidity thins after the lunch hour, which often amplifies breakouts — both genuine and false.
Technical Analysis
Moving Average Structure
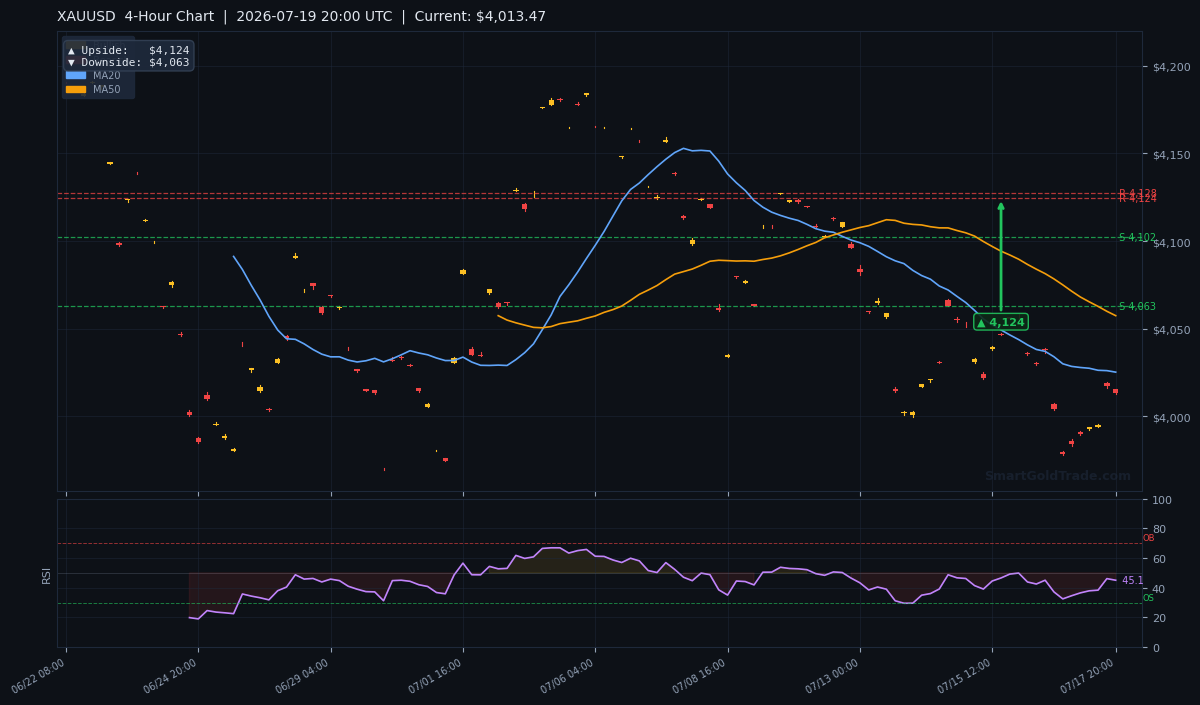
The moving average configuration paints a decisively bearish picture. Price sits below the MA20 at $4,025.26, the MA50 at $4,057.47, and the MA200 at $4,159.27. The short‑term MA20 has crossed below the MA50, confirming a momentum shift to the downside. This stacked resistance means any intraday bounce must chew through three layers of overhead before the trend could even begin to flatten. Traders watching the daily chart will note that price is also below the 200‑day equivalent, a classic bear‑market signal. Unless gold price quickly reclaims $4,025, the path of least resistance is lower. For a deeper look at how these crossovers play out, our moving averages guide for gold trading covers the exact strategies.
RSI and Momentum
The 14‑period Relative Strength Index reads 45.1, squarely in neutral territory. That’s a problem for bulls because after a sharp decline, a truly oversold bounce would require an RSI closer to 30. At 45.1, there is still ample room for further selling before the market becomes exhausted. Momentum oscillators are trending lower, and volume on the sell‑side has been increasing through the European close. This combination suggests the move toward $4,003 is driven by genuine distribution, not a temporary shakeout. If RSI breaks below 40 during the American session, it would confirm accelerating downside momentum.
Key Price Levels
The pivot‑derived support and resistance levels deserve careful attention. Support S1 stands at $4,147.61, S2 at $4,124.26, Resistance R1 at $4,164.23, and R2 at $4,159.15. All of these lie above the current gold price, meaning they have flipped from former support to overhead resistance. More relevant for today’s session are the pivot arrow targets: the 1‑hour downside at $4,003, the 4‑hour downside at $4,063, and the daily downside at $4,076. The $4,003 level is the most immediate magnet, while $4,063 now acts as a resistance ceiling that must be cleared before any recovery gains traction. For gold price traders, this means the upside is capped unless a fresh catalyst materializes.
Fundamental Drivers
Beyond the charts, two narratives are shaping gold this week. First, the June jobs report released last week showed unexpected resilience, which initially sparked a short‑squeeze rally as rate‑hike fears eased. But the market quickly realized that a strong labor market keeps the Fed on a higher‑for‑longer path, and the buying turned into aggressive selling. Second, the Iran‑US tensions that added a risk premium have not escalated further, causing that geopolitical bid to unwind. Without a fresh catalyst, the dollar’s strength — reinforced by hawkish Fed rhetoric from several regional presidents — has taken the wheel. Gold’s inverse correlation with the DXY is back in force, and every tick higher in the greenback is met with gold sellers stepping in.
Key Event to Watch
This week, the single most important event is the Federal Reserve Chair’s semi‑annual testimony before Congress scheduled for Thursday. Markets will parse every word for clues on the September meeting. If the Chair leans hawkish, a drop toward $3,980 could unfold rapidly. A dovish tilt, however, could spark a short‑covering rally that tests the $4,063 resistance. Position sizing ahead of that event is critical, as the testimony has historically triggered sharp 15‑minute swings exceeding $15 in gold price.
Devil's Advocate
The bearish outlook depends on the $4,003 level breaking cleanly. If buyers defend that support and push price back above the MA20 at $4,025.26 with a decisive 4‑hour close, the short‑term bias would flip. A rapid move above $4,063 would then target $4,076, invalidating the 1‑hour downside arrow. Furthermore, if the Fed Chair’s testimony on Thursday surprises with a dovish tone, the dollar could reverse sharply, and gold would be the primary beneficiary. Traders should respect $4,003 as the make‑or‑break pivot; a 4‑hour candle closing above $4,025 is the signal that the downside momentum has stalled.
Trading Strategy for American Session
I’m approaching this session with a bearish bias until proven otherwise. The entry zone is between the current price of $4,013 and a possible retest of the MA20 at $4,025. A limit order to sell at $4,022 — just below the MA20 — offers a favorable risk‑reward. The stop loss goes at $4,037, roughly two times the ATR(14) above the entry, which clears the MA20 and any intraday noise. The primary take‑profit target is $4,003, the 1‑hour pivot downside. If that level breaks, a secondary target at $3,980 is reasonable for a partial position. On SmartGoldTrade’s halal spot gold trading platform, this setup can be executed with no overnight interest charges, keeping the trade Shariah‑compliant. The risk on the trade is approximately 1.2:1, which tightens to 2:1 if the secondary target is hit.
| Timeframe | Upside Target | Downside Target |
|---|---|---|
| Daily | $4,540 | $4,076 |
| 4‑Hour | $4,124 | $4,063 |
| 1‑Hour | N/A | $4,003 |
Key Takeaways
- Gold price has surrendered all gains from the post‑jobs rally and now trades at $4,013.47.
- All major moving averages — MA20 at $4,025.26, MA50 at $4,057.47, MA200 at $4,159.27 — sit above the market, confirming bearish pressure.
- RSI at 45.1 leaves plenty of room for further decline before oversold conditions emerge.
- The 1‑hour pivot downside target is $4,003; a break below opens the door to $3,980.
- A daily close above the MA20 would negate the short‑term bearish thesis.
- Thursday’s Fed Chair testimony is the high‑impact event that could trigger a breakout above $4,063 or a collapse below $4,000.
Conclusion
The gold price chart tells a straightforward story this American session: the failed post‑jobs breakout has left the metal vulnerable, and bears are pressing toward the critical $4,003 inflection point. With the DXY firm and yields refusing to retreat, the path of least resistance is lower. A break below $4,003 will almost certainly trigger algorithmic selling toward the $3,980 area. Bulls need to engineer a quick reclaim of $4,025 to stop the bleeding. Until then, every bounce is a selling opportunity. As always in the New York session, respect the liquidity and watch for a potential late‑day reversal that could trap early sellers. Trade small, keep stops tight, and pay attention to the $4,003 level — it is the line that separates a routine pullback from an acceleration lower.
FAQ
- What is the gold price right now?
- As of July 19, 2026, at 19:52 UTC, spot gold trades at $4,013.47 per troy ounce, down sharply from the earlier week’s high near $4,174.
- What are the key support levels for gold today?
- The most immediate support is the 1‑hour pivot downside at $4,003. Below that, the next psychological level is $3,980. The 4‑hour chart’s former support at $4,063 now acts as resistance.
- What is the trading strategy for the American session?
- The bearish bias suggests selling into rallies near the $4,025 MA20 resistance, with a stop placed above $4,037. The primary target sits at $4,003, and a breakdown there opens a secondary target at $3,980. Using SmartGoldTrade’s halal spot gold trading platform keeps the setup Shariah‑compliant with no swap fees.