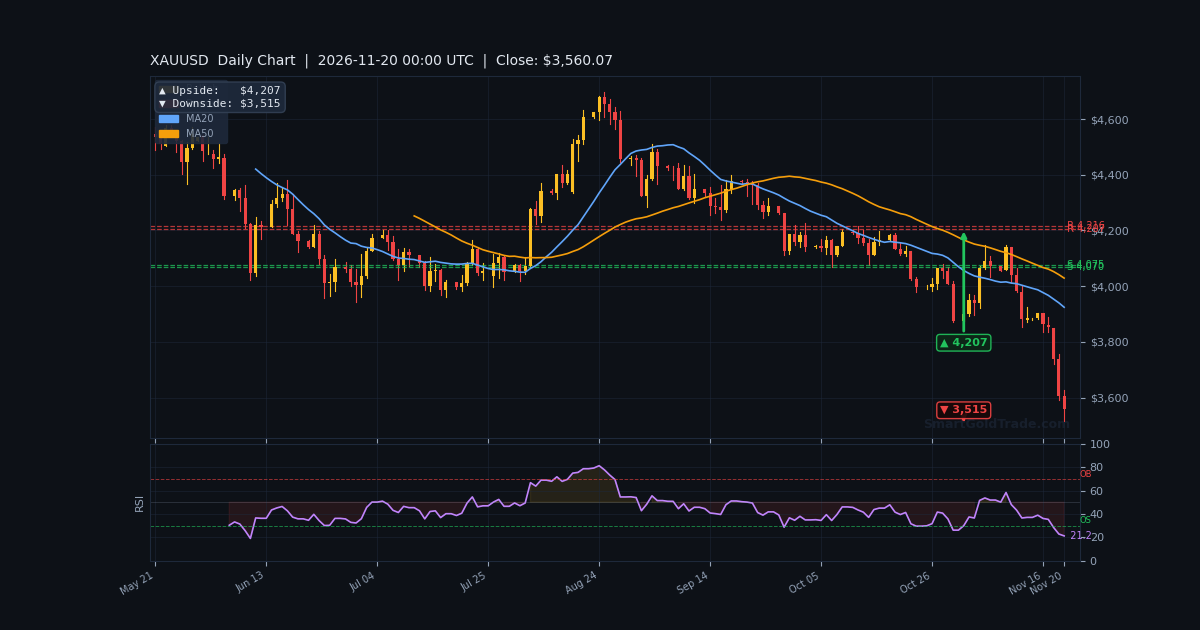
The gold price is trading at $3,544.85 as the European session opens, after a brutal Asian session that saw the metal freefall nearly $120 from Thursday's close. This is the lowest level since September 2025, and the third consecutive day of heavy selling. The catalyst is a perfect storm of hawkish Federal Reserve repricing and a resurgent US Dollar, which is holding near a 19-month peak. Thursday's release of the October FOMC minutes confirmed a near-unanimous consensus for further rate hikes, with markets now pricing a 25-basis-point increase in December as virtually certain. As London liquidity enters the market, the question on every trader's mind is whether this oversold condition can produce a bounce, or if the selling is set to continue.
Gold Market Overview
The gold price finds itself in a fierce bearish grip, driven by a fundamental shift in the macroeconomic landscape. The market is no longer debating the timing of a Fed pivot; it is pricing an extended period of restrictive policy into early 2027. This environment of rising real yields and a strengthening dollar creates a powerful headwind for the non-yielding metal.
Macro Context
The US Dollar Index (DXY) is trading near 104.00, its highest since April 2025, emboldened by a hawkish Fed and safe-haven flows tied to geopolitical tensions with Iran. This dollar strength directly pressures the gold price. Concurrently, the 10-year TIPS real yield has climbed to 2.88%, and the 10-year nominal yield is at 5.07%, making US government debt increasingly attractive versus holding bullion. The market sentiment is heavily risk-off, with Asian equities following Wall Street's sharp reversal, prompting a 'sell-everything' mode that has even forced liquidation of gold positions to cover losses elsewhere.
Session Outlook
As the European session begins, volatility is expected to remain elevated. The market is deeply oversold, which could trigger violent short-covering rallies. However, the dominant trend is firmly bearish. Traders should watch for a potential test of the $3,514.67 support level. A break below could accelerate losses, while a hold could lead to a choppy, range-bound session as the market digests recent moves. Liquidity is likely to be thin, exaggerating price swings.
Technical Analysis
The technical picture for the gold price is unequivocally bearish across all major timeframes, though it is flashing extreme oversold signals that warrant caution for sellers.
Moving Average Structure
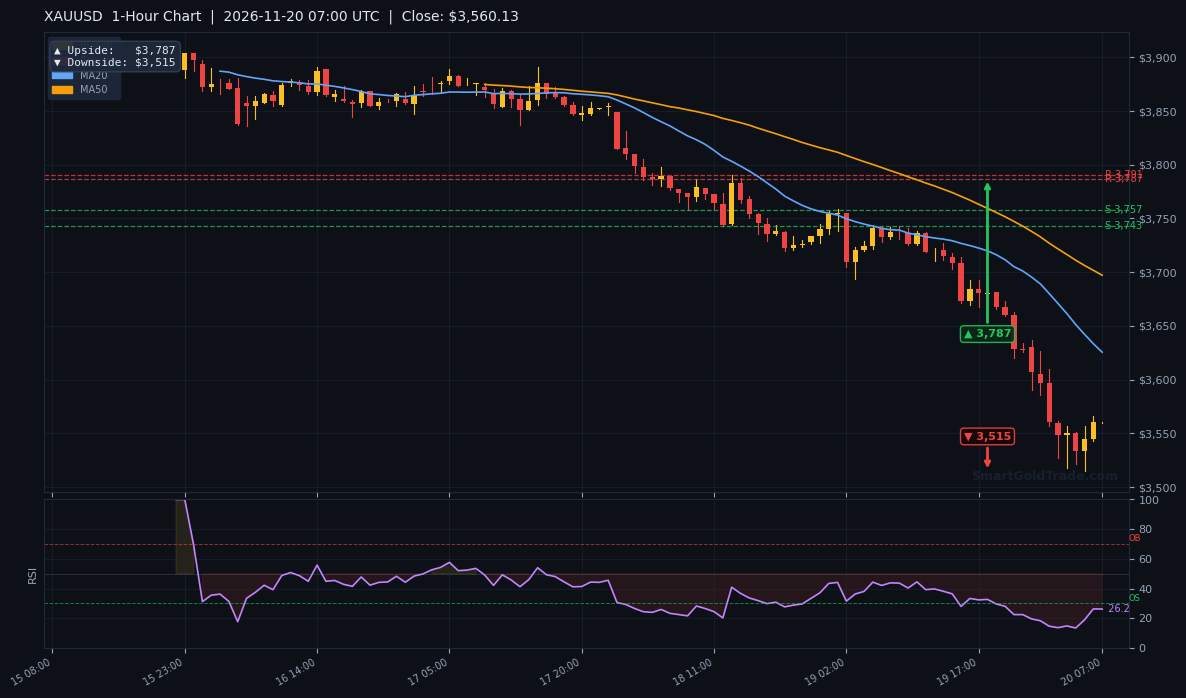
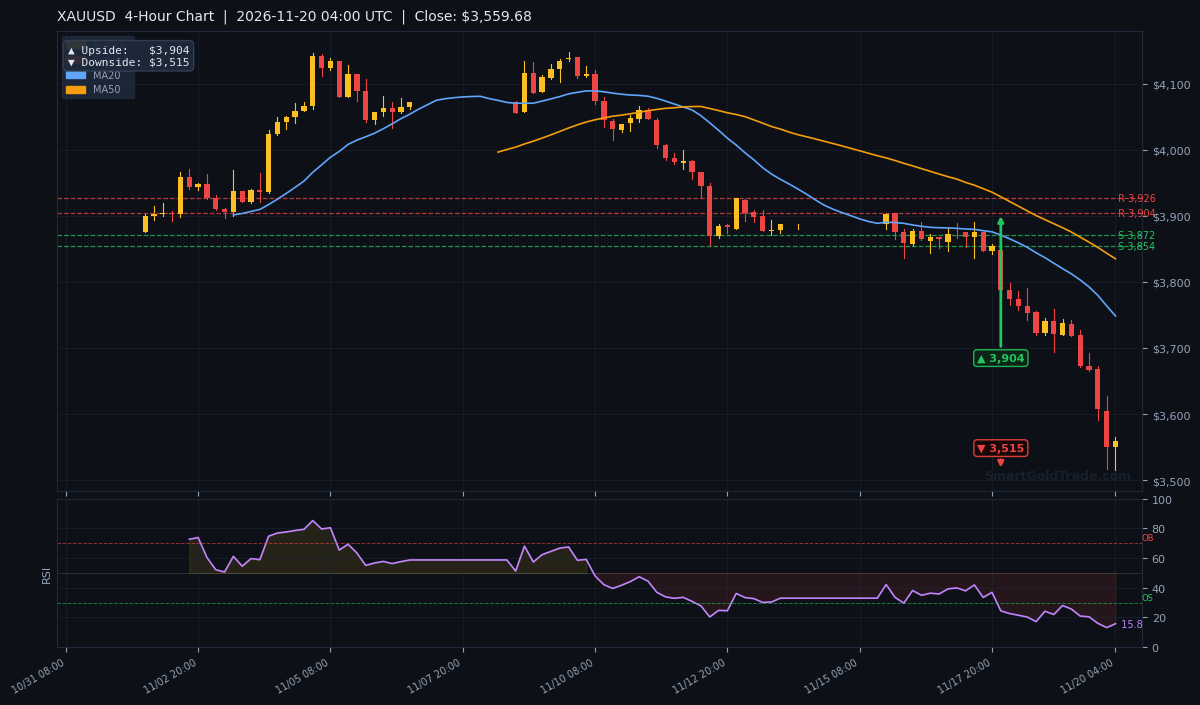
The price is trading far below all key moving averages. On the H1 chart, the EMA20 is at $3,628.04 and the EMA50 is at $3,699.39, confirming a strong short-term downtrend. The EMA200 at $3,848.80 underscores the severity of the sell-off. On the higher timeframes, the H4 EMA50 is at $3,835.77 and the D1 EMA50 is at $4,048.35, showing that the bearish momentum is deeply entrenched.
RSI and Momentum
The RSI(14) on the H1 chart has plummeted to 19.4, deep in oversold territory. This suggests that the selling pressure has been extreme and a corrective bounce is increasingly likely. The Stochastic oscillator is also at 12.9, confirming the oversold condition. However, the MACD is at -51.89, with its histogram widening, indicating that bearish momentum is still strong. The ADX is at a very high 57.9, confirming the strength of the current trend. The message is clear: the trend is down, but the rubber band is stretched to its limit.
Key Price Levels
Immediate support is at S1 $3,514.67, which aligns with the 1-hour downside target. A break below this level would open the door for a deeper correction. Resistance is now at R1 $3,758.56 (Thursday's high), which is the first major hurdle for any bounce. The ATR(14) is at $28.28, suggesting an expected trading range of roughly $28 for the session. Given the current volatility, this could easily be exceeded. The 1-hour chart below shows the recent price action and key levels.
The 4-hour chart provides a broader view of the downtrend, confirming the bearish structure and the key levels to watch.
Fundamental Drivers
The fundamental backdrop for the gold price is overwhelmingly bearish. The market is reacting to a hawkish Fed and a strong dollar, which are the primary drivers of the current sell-off. The October FOMC minutes, released on Wednesday, showed that nearly all officials expect further rate hikes to combat inflation, cementing expectations for a December hike and potentially more in early 2027. This has pushed the dollar to a 19-month high and sent real yields soaring.
Key Event to Watch
With no high-impact US economic data scheduled for today, the market will continue to digest the Fed's hawkish stance. The most significant upcoming event is the December FOMC meeting, where a rate hike is almost fully priced in. Until then, the focus will remain on Fed speak and any geopolitical developments. Any hint of a less aggressive Fed could trigger a sharp short-covering rally in the gold price. For those looking to trade these moves, professional gold trading signals can provide real-time entry and exit points.
Unified Technical & Fundamental Outlook
The technical and fundamental pillars are perfectly aligned in their bearishness. The technical score of -0.92 reflects a deeply entrenched downtrend across all timeframes, with price well below key moving averages and momentum indicators pointing lower. The fundamental score of -0.53 is driven by rising real yields, a strong dollar, and outflows from gold ETFs like GLD, which saw a 4.6-tonne decline yesterday. The combined assessment is a bearish score of -0.72, with aligned bearish sentiment. The only note of caution is the extremely oversold RSI, which suggests a potential for a violent, but likely short-lived, counter-trend bounce. The primary trend remains down.
Devil's Advocate
What could invalidate the bearish bias? The most obvious risk is a massive short-covering rally triggered by the oversold conditions. If the price can reclaim the $3,628.04 level (H1 EMA20), it could signal a temporary bottom. A more significant reversal would require a break above $3,758.56 (R1). Also, any unexpected geopolitical de-escalation or a surprisingly dovish comment from a Fed official could spark a rally. However, until the fundamental drivers of dollar strength and rising yields change, any rally is likely to be sold into. A daily close above the $3,628.04 level would be the first sign that the bears are losing control.
Trading Strategy for European Session
Given the extreme oversold conditions and the strong downtrend, a cautious approach is warranted. The primary strategy is to sell rallies, but only after a corrective bounce. An ideal entry zone for a short position would be near the $3,628.04 level (H1 EMA20), with a stop-loss above $3,646.77 to protect against a short squeeze. This is a high-risk, high-reward counter-trend trade. For those looking to buy physical gold on dips, the purchase physical gold page offers options.
Key Takeaways
- The gold price is at $3,544.85, down over 2% for the day and at a 14-month low.
- The H1 RSI is at a deeply oversold 19.4, signaling a high probability of a corrective bounce.
- The primary trend is bearish, with price well below the H1 EMA200 of $3,848.80.
- Immediate resistance for any bounce is at $3,628.04 (H1 EMA20) and then $3,758.56 (R1).
- Fundamentals remain bearish due to a hawkish Fed, rising real yields, and a strong dollar.
Conclusion
The gold price is in a precarious position, caught between a powerful fundamental downtrend and extreme technical oversold conditions. The path of least resistance remains to the downside, but a bounce is overdue. For the European session, the key level to watch is $3,514.67. Traders should remain nimble and respect the primary downtrend, selling rallies unless the price can convincingly break above the H1 EMA20. The overall outlook remains bearish until the fundamental landscape shifts.
Frequently Asked Questions
- What is the current gold price?
- As of the European session open on November 20, 2026, the gold price is trading at $3,544.85 per ounce.
- Is now a good time to buy gold?
- With the gold price deeply oversold and at a 14-month low, it may be an attractive level for long-term physical buyers. However, the short-term trend is bearish, so waiting for a confirmed reversal above $3,628.04 could be prudent. For those looking to buy, certified gold coins and bars are available.
- What are the key support and resistance levels for gold?
- Immediate support is at $3,514.67 (S1). Key resistance levels are at $3,628.04 (H1 EMA20) and $3,758.56 (R1).
- Why is the gold price falling?
- The gold price is falling due to a hawkish Federal Reserve, which is expected to continue raising interest rates. This has strengthened the US Dollar to a 19-month high and pushed real yields higher, making gold less attractive.
Trading Gold (XAU/USD) carries significant risk of loss and is not suitable for all investors. This content is for informational purposes only and does not constitute financial advice. Always conduct your own research and trade responsibly.