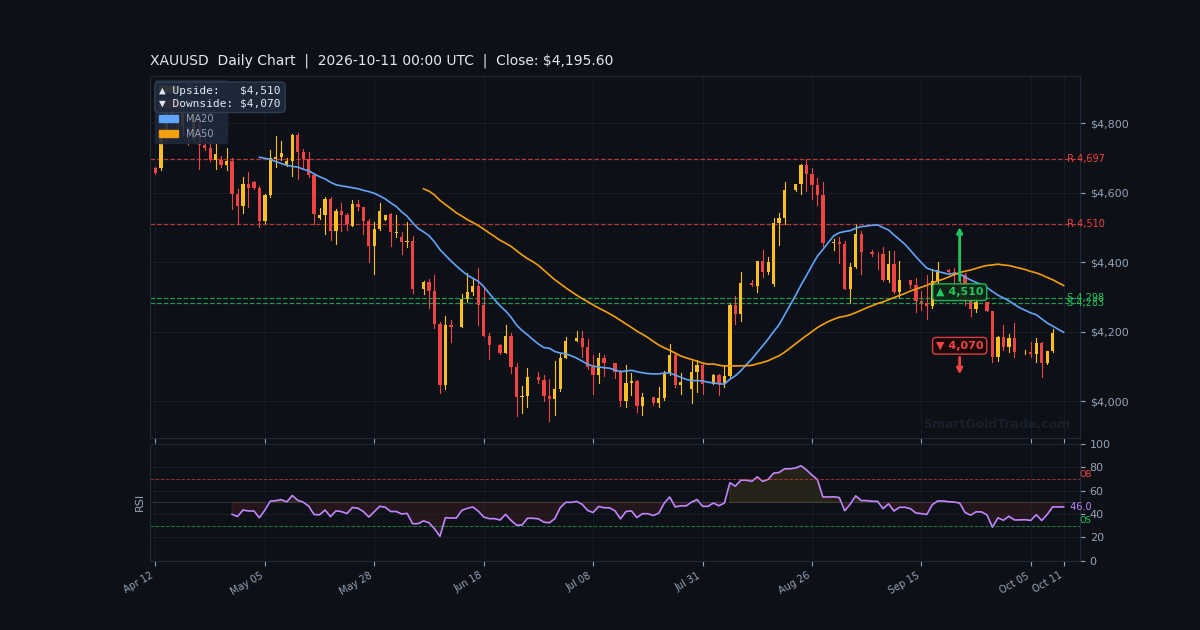
Gold trades at $4,195.60 per troy ounce as the new week opens, coiled directly beneath the $4,203 pivot that has capped every rally attempt since Thursday. This gold price forecast next week covers October 11 through October 17, 2026, and maps the exact levels, catalysts and trade plans that matter for XAU/USD. Last week delivered a bruising mid-week slide below $4,100 before buyers reclaimed the $4,200 handle into Friday's close.
The week's direction hinges on one question: can US inflation data cool enough to keep the Fed's December hike debate alive?
Last Week in Review
Gold finished last week higher but well off its best levels, with a $4,100 flush and a $4,300 rejection defining the range. The weekly candle closed bullish, though the long upper wick warns that sellers remain active above $4,250.
Price Action Recap
Monday opened firm as geopolitical headlines and shifting Fed hike bets supported bullion. The advance stalled midweek when FOMC Minutes signaled further tightening, dragging XAU/USD below $4,100 in the sharpest session of the week.
Bulls responded immediately. Gold jumped 5% on war-end optimism headlines, briefly tagging the $4,300 region before fading, then rallied 3% toward $4,500 as Treasury intervention headlines hit the tape. Both spikes failed to hold.
Friday's NFP report produced a muted reaction, with price grinding back toward $4,200 as US yields retreated. The week's high printed near $4,300, the low near $4,090, and gold closed at $4,195.60 — squarely mid-range.
Key Events That Moved Gold
Last week's FOMC Minutes were the dominant catalyst, signaling that further Fed hikes remain on the table and pushing rate-hike expectations toward December. Gold slid below $4,100 in the immediate aftermath before dip-buyers absorbed the supply.
The NFP report landed without drama, with StoneX noting that XAU/USD remained under pressure even after the release. Markets read the data as neither hot enough to force a November hike nor weak enough to trigger aggressive easing bets.
Geopolitical developments cut both ways. War-end optimism headlines sparked a 5% rally, while Treasury intervention news added another 3% surge — but both moves reversed, confirming that headline-driven spikes are being sold into.
Weekly Close Analysis
Gold closed at $4,195.60, holding above the $4,170.90 support that defined Thursday's base. The close sits just $7.40 below the $4,203 pivot, keeping the pair in a tight decision zone heading into the new week.
The weekly structure is constructive but not convincing. Bulls defended critical support as FOREX.com noted, yet the repeated failures above $4,300 leave a supply overhang that must be cleared before the next leg higher can develop.
Next Week Economic Calendar & Gold Impact
This week's calendar is headlined by US CPI, which lands Wednesday and will likely determine whether gold breaks $4,203 or retests $4,170. Fed speakers and retail sales data add secondary volatility.
| Day | Event | Forecast | Previous | Gold Impact |
|---|---|---|---|---|
| Mon, Oct 12 | Fed Speakers (multiple) | — | — | Hawkish tone → bearish; dovish → bullish |
| Tue, Oct 13 | US PPI (Sep) | 0.3% m/m | 0.4% m/m | Hot → bearish; cool → bullish |
| Wed, Oct 14 | US CPI (Sep) | 3.1% y/y | 3.2% y/y | Miss → dovish, gold rallies; beat → hawkish, gold slides |
| Thu, Oct 15 | US Retail Sales (Sep) | 0.4% m/m | 0.6% m/m | Strong → hawkish, bearish; weak → dovish, bullish |
| Fri, Oct 16 | U. Michigan Sentiment | 68.5 | 70.1 | Weak → risk-off, mildly bullish |
Wednesday's CPI is the week's fulcrum. A downside surprise toward 3.0% would validate the disinflation narrative, pull December hike odds lower, and open the path toward $4,300 and beyond.
An upside surprise at 3.3% or higher would revive hawkish pressure, likely forcing gold back beneath $4,170.90 and exposing the $4,070 downside target from the daily pivot study.
Monday's Fed speakers set the tone before CPI. If officials echo last week's Minutes language about further hikes, expect gold to stay pinned under $4,203 until Wednesday's data resolves the debate.
Technical Analysis
Gold's technical picture is cautiously bullish: the H1 moving average structure remains positive while RSI sits in neutral territory. Price is compressed between $4,170.90 support and $4,203.00 resistance, a $32 range that precedes expansion.
Moving Average Structure
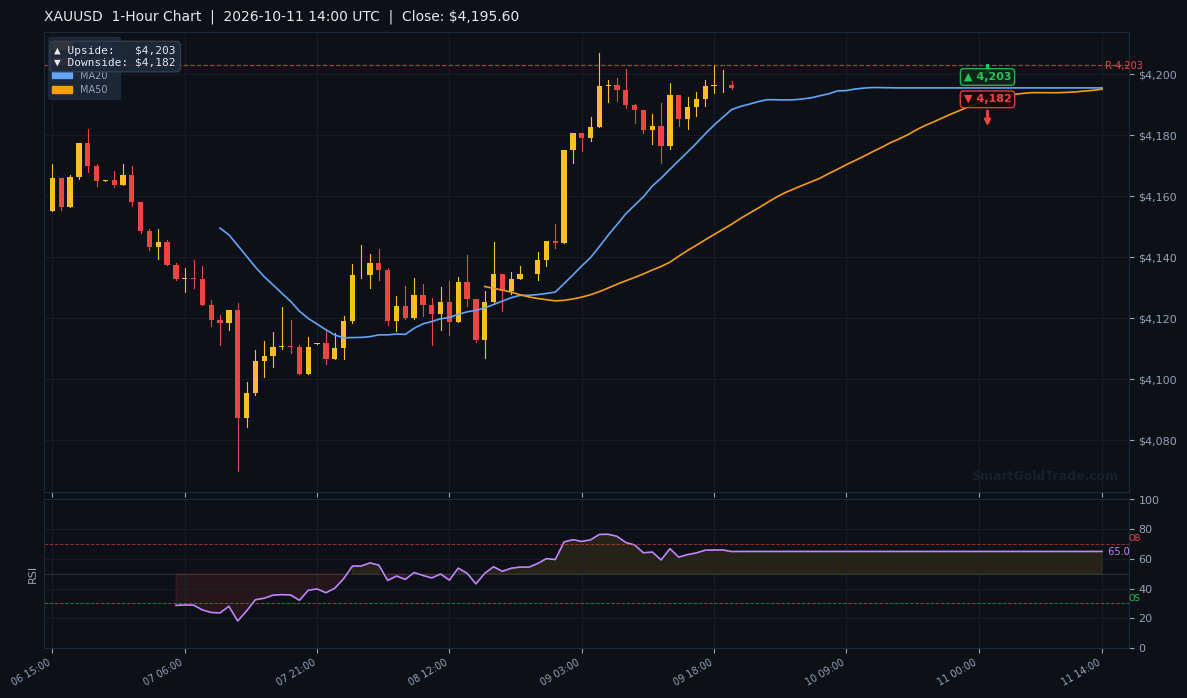
The H1 chart shows MA20 at $4,195.60 sitting directly above MA50 at $4,195.21, a marginally bullish alignment. The spread is just $0.39 — extraordinarily tight — signaling a market in equilibrium and vulnerable to a decisive breakout.
Price trading at the MA20 means bulls hold a slight edge, but only barely. A sustained break below the MA50 would flip the short-term bias bearish and target the $4,170.90 support shelf.
RSI and Momentum
RSI(14) reads 65.1, squarely in neutral territory with a mild bullish lean. The reading is neither overbought nor oversold, leaving ample room for a push toward 70 if momentum builds.
However, the failure of RSI to reach overbought during last week's spikes to $4,300 suggests waning upside momentum. Traders should watch for bearish divergence if price makes a higher high while RSI stalls below 70.
Key Support and Resistance Levels
- R2: $4,207.10 — immediate ceiling above the pivot
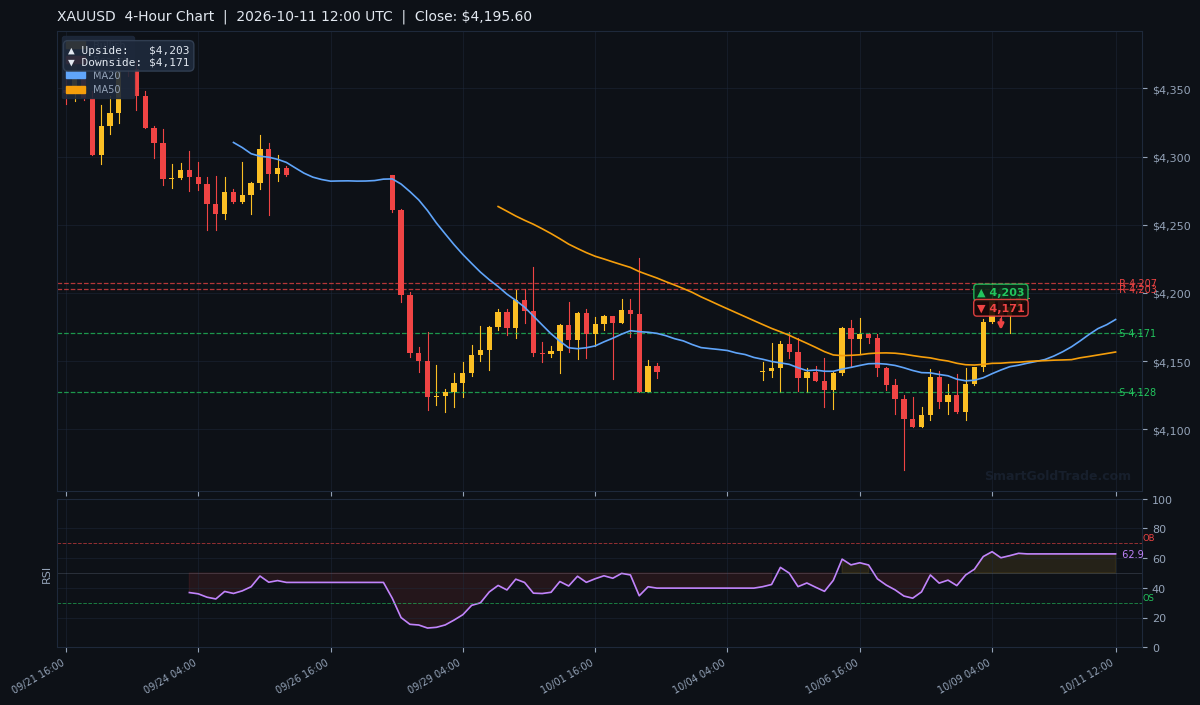
- R1: $4,203.00 — the level capping every rally since Thursday
- Price: $4,195.60 — trading at MA20, between the averages
- S1: $4,170.90 — critical support; a break opens $4,070
Chart-based targets frame the week's boundaries. The daily study projects an upside objective of $4,510 and a downside target of $4,070, while the 4-hour and 1-hour charts both point to $4,203 on the topside with $4,171 and $4,182 respectively on the downside.
An ATR-informed weekly range, using the $4,070–$4,510 daily envelope as the outer boundary, suggests a realistic trading band of roughly $4,140 to $4,310 if CPI delivers a clear directional signal.
Trading Scenarios This Week
Three scenarios cover the likely paths: a CPI-driven breakout above $4,203, a hawkish breakdown below $4,170.90, or continued compression inside the current range. Probabilities weight the bullish case slightly higher given the MA structure.
Bullish Scenario (probability 45%)
Trigger: CPI prints at or below 3.1% y/y, weakening December hike odds. Entry zone: $4,196–$4,203 on a confirmed H1 close above $4,203.
- Entry: $4,203 breakout retest
- Target 1: $4,207 (R2)
- Target 2: $4,310 (weekly range top)
- Target 3: $4,510 (daily chart upside objective)
- Stop loss: $4,170 (below S1)
Bearish Scenario (probability 35%)
Trigger: CPI at 3.3% or higher, reviving hawkish Fed expectations. Entry zone: $4,195–$4,190 on rejection at the MA20.
- Entry: $4,190 short on failed $4,203 retest
- Target 1: $4,171 (S1)
- Target 2: $4,140 (weekly range floor)
- Target 3: $4,070 (daily chart downside objective)
- Stop loss: $4,208 (above R2)
Neutral / Range-Bound Scenario
If CPI lands in line at 3.1–3.2%, gold likely stays trapped between $4,170.90 and $4,203.00. Mean-reversion traders can sell $4,202 and buy $4,172 with tight stops outside the range.
Range conditions favor patience over conviction. Watch for a false break of either boundary as a liquidity grab before the true direction emerges later in the week.
Risk Factors to Watch
The primary invalidation level is $4,170.90 — a daily close below it flips the weekly bias bearish and targets $4,070. Conversely, a daily close above $4,207.10 confirms the bullish breakout toward $4,310.
Black-swan risks include an unscheduled geopolitical escalation, a surprise Fed emergency communication, or a Treasury market dislocation. Any of these could override technical levels and produce outsized moves in either direction.
Traders running automated strategies through Wednesday's CPI release should consider pausing execution during the 13:30 UTC print. Tools like a news event trading protection system can automate that pause and prevent slippage-driven losses.
Key Takeaways
- Gold trades at $4,195.60, pinned below $4,203.00 resistance and above $4,170.90 support.
- MA20 ($4,195.60) holds a razor-thin $0.39 edge over MA50 ($4,195.21) — a bullish but fragile structure.
- RSI at 65.1 is neutral, leaving room for a push to overbought if CPI misses forecasts.
- Wednesday's US CPI is the week's decisive catalyst; a miss targets $4,510, a beat risks $4,070.
- Bullish trigger: H1 close above $4,207.10. Bearish trigger: daily close below $4,170.90.
- Weekly trading band: roughly $4,140 to $4,310 under a clear CPI outcome.
Conclusion
The weekly bias is cautiously bullish, with gold holding a marginal moving-average advantage and RSI offering room to run. That said, the $4,203.00 pivot has rejected every advance since Thursday, making it the single most important level on the board.
If you're looking to hold gold beyond this week's noise, SmartGoldTrade's Shariah-compliant gold investment pools offer 6-month to 3-year terms with a 4–8% profit share, audited quarterly. For shorter-term exposure, halal gold trading lets you own physical gold by the gram from $1 with no leverage and no CFDs.
FAQ
What is the gold price forecast for next week?
Gold is expected to trade between roughly $4,140 and $4,310 next week, with the bias cautiously bullish while price holds above $4,170.90. A CPI miss could push XAU/USD toward $4,300–$4,510, while a hot print risks a slide to $4,070.
What levels should I watch on gold this week?
The key levels are $4,203.00 resistance and $4,170.90 support. A confirmed H1 close above $4,207.10 opens the upside toward $4,310, while a daily close below $4,170.90 flips the bias bearish and targets $4,070.
How does US CPI affect the gold price next week?
Wednesday's CPI is the week's decisive catalyst. A reading at or below 3.1% y/y would weaken December hike odds and likely lift gold above $4,203, while a print at 3.3% or higher revives hawkish Fed pressure and could drag XAU/USD back toward $4,170 or lower.
Risk disclaimer: This article is for informational purposes only and does not constitute investment advice. Gold trading and investing carry significant risk, including the possible loss of principal. Past performance is not indicative of future results. Please conduct your own research and consult a qualified financial advisor before making any trading decisions.
Trading Gold (XAU/USD) carries significant risk of loss and is not suitable for all investors. This content is for informational purposes only and does not constitute financial advice. Always conduct your own research and trade responsibly.