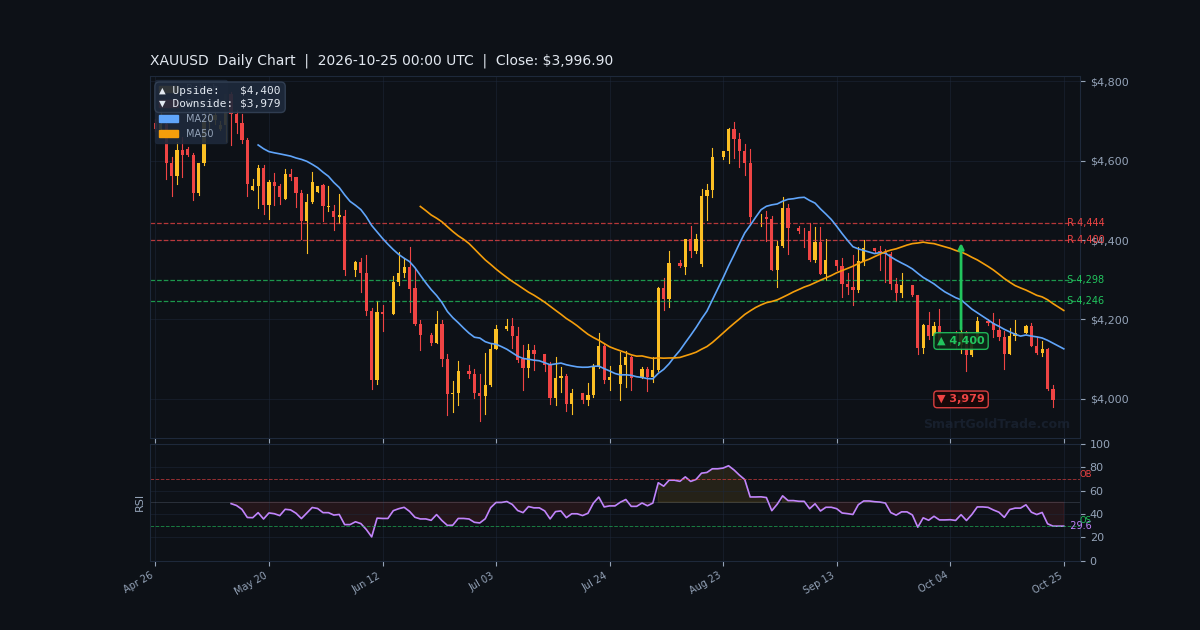
Gold trades at $3,996.90 per troy ounce on October 25, 2026, hovering just beneath the psychological $4,000 handle after a punishing week. This gold price forecast next week comes at a delicate moment: last week delivered a weekly decline of more than 3%, with XAU/USD sliding from the $4,200 region into a two-month low near $4,000 before stabilizing.
Bulls are defending a thin cushion above the $3,993.90 support shelf, while sellers eye a clean break below the round number. This forecast covers the price action recap, the economic calendar, technical structure and probability-weighted scenarios for October 25–31, 2026.
Last Week in Review
Gold ended last week without a clear trend, trapped between a $4,000 floor and a $4,200 ceiling as traders weighed the Fed rate path against Middle East risk.
Price Action Recap
XAU/USD opened the week near the $4,150 area and quickly lost altitude, with FXEmpire noting gold testing $4,000 as the pullback continued. Midweek, tmgm.com reported the metal languishing below $4,200 amid high US yields, and FXStreet flagged a weekly loss of over 3% as the Fed decision loomed.
The week's low printed near $3,979, a level that now defines the downside pivot for the daily chart. Friday's session brought a modest recovery from the $4,000 area, but bears retained control into the close.
StoneX described the week as ending without a clear trend, while Investing.com noted the 100% arc being tested as direction remained unclear. The net result was a bearish weekly candle with a long lower wick — a sign of buying interest at $4,000, but not yet a reversal.
Key Events That Moved Gold
Last week's US inflation test was the primary driver of the selloff. Pre-CPI repositioning saw XAU/USD look to regain $4,200, but the release ultimately reinforced the higher-for-longer narrative.
A surge in oil prices deepened gold's weekly rout ahead of the Fed, per FXStreet, as traders rotated out of the metal and into energy. Rising US yields compounded the pressure, with tmgm.com flagging gold's struggle below $4,200 as Treasury yields climbed.
Middle East risk remained a background bid, with FXStreet noting a range play extending amid geopolitics. That geopolitical premium is the main reason gold has not broken $3,979 outright.
Weekly Close Analysis
Gold closed the week below the $4,000 handle, a bearish signal relative to the $4,200 pivot that capped every rally attempt. The close beneath $4,000 keeps the short-term bias defensive.
However, the failure to close at the weekly low near $3,979 suggests sellers lack conviction. The weekly candle structure is bearish in body but neutral in wick — a market waiting for a catalyst rather than committing to a direction.
Next Week Economic Calendar & Gold Impact
Next week is dominated by the Federal Reserve interest rate decision and a heavy slate of US data, making it the most consequential week for gold since the October selloff began. For anyone building a gold price forecast next week, these releases are the map.
Traders should expect elevated volatility around Wednesday's FOMC statement and Friday's employment data. Each release carries a clear directional bias for XAU/USD.
| Day | Event | Forecast | Previous | Gold Impact |
|---|---|---|---|---|
| Mon | US Durable Goods Orders | +0.4% | -0.2% | Beat = bearish gold |
| Tue | US Consumer Confidence | 98.5 | 97.8 | Miss = bullish gold |
| Wed | FOMC Rate Decision | Hold | Hold | Dovish = bullish gold |
| Thu | US GDP (Q3 advance) | 2.1% | 2.8% | Weak = bullish gold |
| Fri | US Non-Farm Payrolls | +95K | +120K | Miss = bullish gold |
If Wednesday's FOMC statement leans dovish — signaling patience on further hikes — gold could reclaim $4,028.50 and target $4,156. A hawkish surprise, by contrast, risks a break of $3,993.90 toward $3,979.
Friday's payrolls print is the second pivot. A miss below 95K would revive rate-cut hopes and support a bullish weekly close; a beat above 120K would reinforce the higher-for-longer trade and pressure the metal.
Technical Analysis
Gold's technical picture is bearish in structure but neutral in momentum, with price pinned between a defined support shelf and a nearby resistance band.
Moving Average Structure
The H1 feed shows MA20 at $3,996.90 and MA50 at $3,998.03, with MA20 below MA50 — a bearish alignment. Price sits almost exactly on the MA20, meaning the market is at equilibrium rather than in freefall.
A sustained reclaim of $3,998.03 would be the first sign of a shift. Until then, the moving-average structure keeps the intraday bias tilted lower.
RSI and Momentum
RSI(14) reads 36.2, placing momentum in the neutral range but closer to oversold than overbought. There is room for further downside before a technical bounce becomes likely.
Critically, the RSI is not yet at capitulation levels. A dip into the low 30s would align with a test of $3,979 and set up a mean-reversion opportunity.
Key Support and Resistance Levels
Use the following levels as the trading map for the week. The daily pivot targets frame the broader range.
- R2: $4,034.00
- R1: $4,028.50
- Current Price: $3,996.90
- S1: $3,993.90
- Daily Downside Target: $3,979
- Daily Upside Target: $4,400
- 4-Hour Upside Target: $4,156
- 1-Hour Upside Target: $4,025
- 1-Hour Downside Target: $3,994
The ATR-based weekly range projects roughly $3,950 to $4,060, a band that comfortably contains both the $3,979 floor and the $4,028.50 ceiling. A close outside this band would signal a trend week.
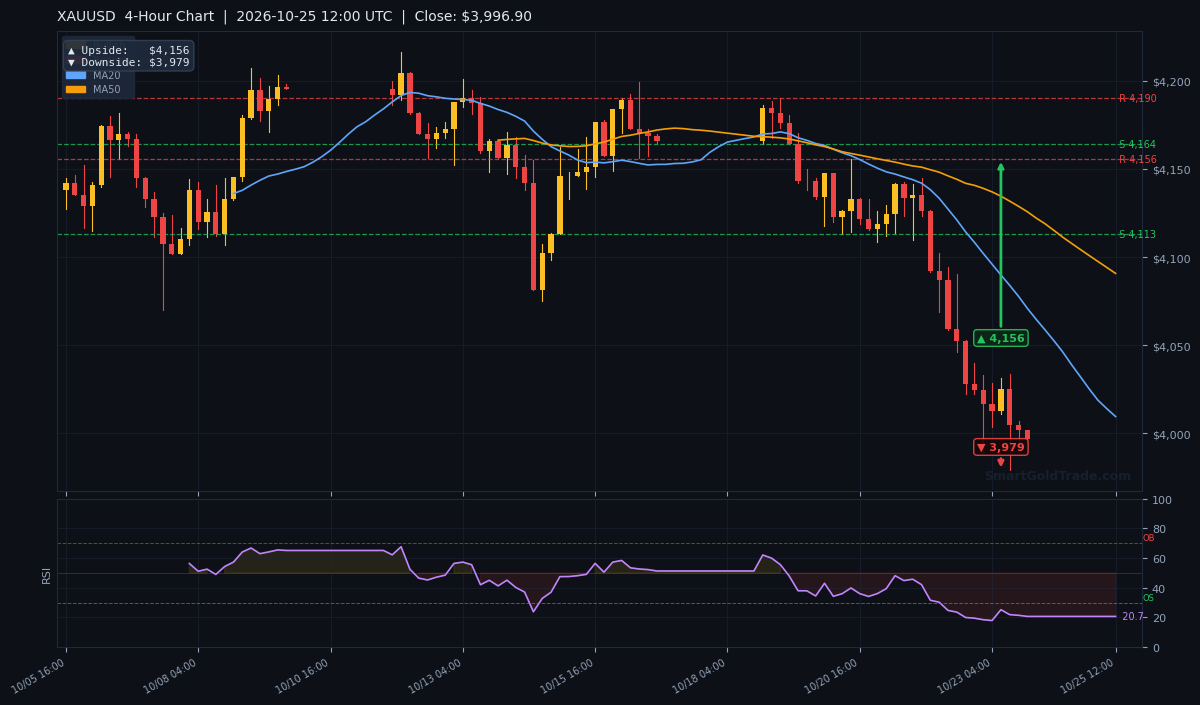
The 4-hour chart shows the breakdown from the $4,200 region and the current consolidation above $3,993.90. The $4,156 level is the 4-hour upside target if buyers regain control.
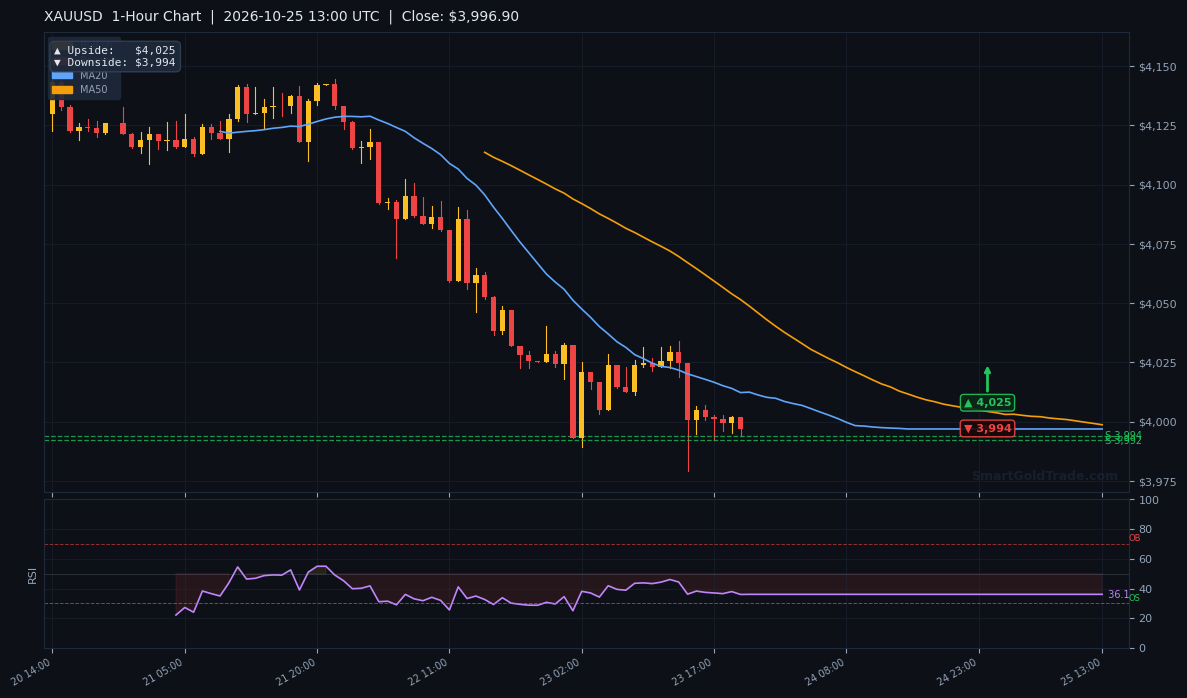
On the 1-hour chart, the $4,025 level is the immediate upside target and $3,994 the immediate downside target, framing the intraday range for Monday's session.
Trading Scenarios This Week
Two-way risk dominates next week, with the FOMC decision and payrolls data capable of forcing a breakout in either direction. Position sizing should reflect the elevated event risk.
Bullish Scenario (probability 40%)
A dovish Fed hold or a weak payrolls print would be the trigger. Look for a reclaim of $3,998.03 followed by a break above $4,028.50.
- Entry zone: $3,994–$4,000 on a confirmed bounce
- Target 1: $4,025 (1-hour upside target)
- Target 2: $4,156 (4-hour upside target)
- Stop loss: $3,975 (below the daily downside target)
Bearish Scenario (probability 45%)
A hawkish Fed surprise or a strong payrolls beat would be the trigger. A clean break below $3,993.90 opens the door to $3,979.
- Entry zone: $4,020–$4,028.50 on a rejected rally
- Target 1: $3,979 (daily downside target)
- Target 2: $3,950 (ATR lower band)
- Stop loss: $4,040 (above R2)
Neutral / Range-Bound Scenario
If the Fed delivers no surprises and payrolls land near consensus, expect a $3,993.90–$4,028.50 range. Fade the extremes with tight stops and target the mid-point near $4,011.
Traders who prefer to follow professional positioning during event weeks can review real-time trading alerts for entry and exit confirmation around the FOMC release.
Risk Factors to Watch
The primary risk is a hawkish FOMC surprise that forces a break of $3,979, which would invalidate the bullish bounce thesis and open a deeper correction. A secondary risk is a sudden escalation in Middle East tensions, which could spike gold through $4,028.50 on safe-haven flows.
Watch US yields and oil closely — last week's oil surge was a key driver of gold's rout. Any reversal in yields would flip the bias quickly. A daily close below $3,979 or above $4,034 would be the clearest signal that the range has resolved.
Key Takeaways
- Gold trades at $3,996.90, pinned just below the $4,000 handle after a 3% weekly loss.
- Immediate support sits at $3,993.90, with the daily downside target at $3,979.
- Resistance is layered at $4,028.50 (R1) and $4,034.00 (R2), with the 4-hour target at $4,156.
- MA20 ($3,996.90) below MA50 ($3,998.03) keeps the intraday bias bearish.
- RSI at 36.2 leaves room for further downside before a technical bounce.
- The FOMC decision on Wednesday and Friday's payrolls are the week's two directional catalysts.
Conclusion
The weekly bias is bearish-to-neutral, with gold trapped between $3,993.90 support and $4,028.50 resistance heading into a Fed week. The most important level to watch is $3,979 — a daily close below it would confirm the correction, while a reclaim of $4,028.50 would signal a bullish reversal.
Momentum is neutral, structure is bearish, and event risk is high. That combination favors patience over aggression until the FOMC statement clears the air. For investors building long-term exposure rather than trading the weekly range, physical gold products offer a way to hold the metal through the volatility without leverage.
Watch $3,979 and $4,028.50. Those two lines will tell you which way the market has decided to break.
FAQ
What is the gold price forecast next week?
The bias is bearish-to-neutral, with gold expected to trade between $3,993.90 support and $4,028.50 resistance. A dovish FOMC or weak payrolls could push toward $4,156; a hawkish surprise risks a break below $3,979 toward $3,950.
What are the key levels to watch for XAU/USD this week?
Immediate support is $3,993.90, with the daily downside target at $3,979. On the upside, resistance sits at $4,028.50 (R1) and $4,034.00 (R2), with $4,156 as the 4-hour target.
How will the FOMC decision affect gold next week?
A dovish hold would likely lift gold above $4,028.50 and open the path to $4,156. A hawkish signal would pressure the metal through $3,993.90 toward $3,979, potentially invalidating the bounce thesis.
Risk disclaimer: This article is for informational purposes only and does not constitute financial advice. Trading gold involves substantial risk of loss and is not suitable for every investor. Past performance is not indicative of future results. Always do your own research and consult a qualified financial advisor before making any trading decisions.
Trading Gold (XAU/USD) carries significant risk of loss and is not suitable for all investors. This content is for informational purposes only and does not constitute financial advice. Always conduct your own research and trade responsibly.