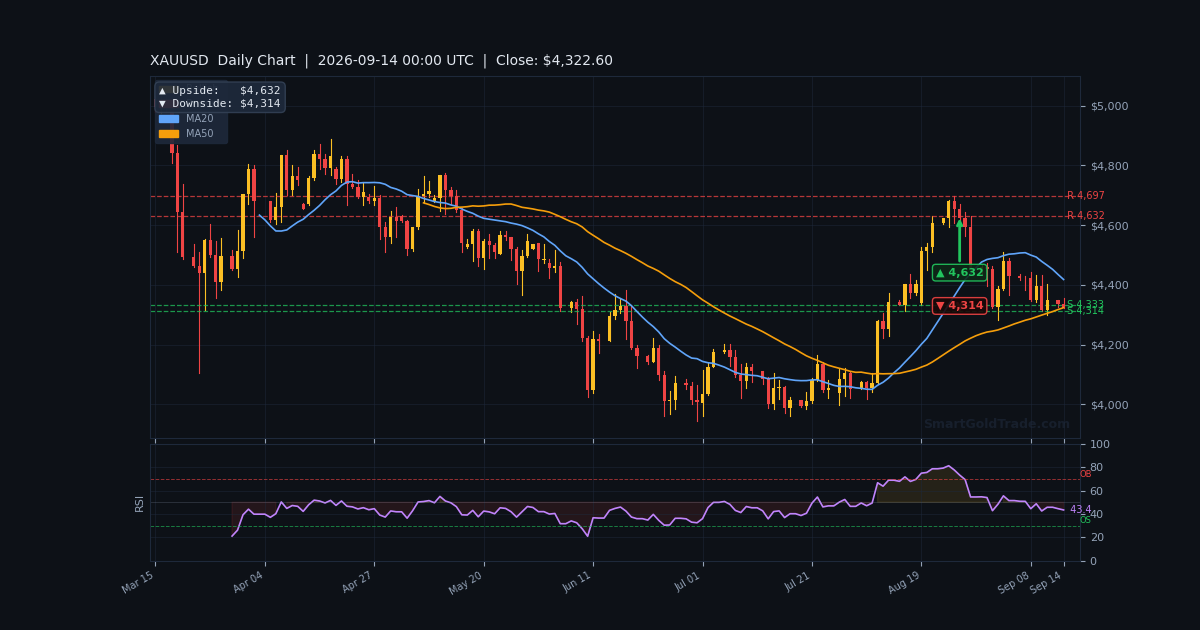
The gold price is trading at $4,337.40 in the European session, pinned just above the critical $4,324.68 support level that has held since Friday's CPI-driven selloff. Last week's hotter-than-expected US inflation data pushed Fed rate hike odds to 87% for Wednesday's decision, and the metal is still absorbing that hawkish repricing.
Price sits below the EMA200 at $4,399.80, confirming the bearish structure that has dominated since the PPI shock. Momentum is neutral — RSI at 46.1 — but the tight Bollinger squeeze suggests a breakout is loading.
This session, traders should watch whether $4,324 holds as the floor or gives way to a deeper slide toward $4,298.
Gold Market Overview
Macro Context
The US Dollar Index is grinding higher for a third straight session, last near 99.30, as markets fully price a quarter-point Fed hike on Wednesday. The CME FedWatch tool shows 87% probability, up sharply from 59% a week ago. That dollar strength is the primary cap on the gold price right now.
Friday's CPI report showed headline inflation at 3.4% year-on-year, with core CPI rising 0.3% month-on-month — hotter than the 0.2% consensus. Treasury yields have climbed in response, raising the opportunity cost of holding non-yielding bullion.
Geopolitical risk remains a background bid, but it is not strong enough to offset the macro headwind. Central bank demand continues quietly, though it rarely moves intraday price.
Session Outlook
European liquidity is arriving, and volatility is picking up. The ATR of $18.93 implies an expected hourly range of roughly 0.44% — enough for a clean test of either $4,324 or $4,362 before the US open.
ADX at 16.4 signals a weak, ranging market, so expect chop between the Bollinger bands at $4,311.68 and $4,350.14 unless a catalyst forces expansion. The London open often sets the tone for the New York session.
Technical Analysis
Moving Average Structure
The gold price is trading below all three key moving averages — EMA20 at $4,344.37, EMA50 at $4,356.11, and EMA200 at $4,399.80. This stacked alignment confirms a bearish trend structure on the H1 timeframe.
On the higher timeframes, the H4 EMA200 sits at $4,373.75 and the D1 EMA200 at $4,320.44. The daily EMA200 is the last major support before a deeper correction, making the $4,320–$4,324 zone the line in the sand.
RSI and Momentum
RSI(14) reads 46.1 — firmly neutral, with no oversold signal yet. Stochastic at 14.3/21.1 is deeply oversold, hinting at a possible short-term bounce. MACD at -5.77 with a histogram of -1.64 shows bearish momentum is still in control but not accelerating.
This mixed picture means neither bulls nor bears have a clear edge. A break of $4,324 would likely trigger momentum selling; a reclaim of $4,344 would open the door to $4,356.
Key Price Levels
Immediate support rests at S1 $4,324.68 and S2 $4,324.17 — a tight cluster that forms the session's make-or-break floor. Below that, the daily EMA200 at $4,320.44 is the next defense.
Resistance begins at R1 $4,362.06, then R2 $4,371.84. The H4 EMA200 at $4,373.75 reinforces that upper zone. Yesterday's high at $4,402.63 remains the bigger target if bulls regain control.
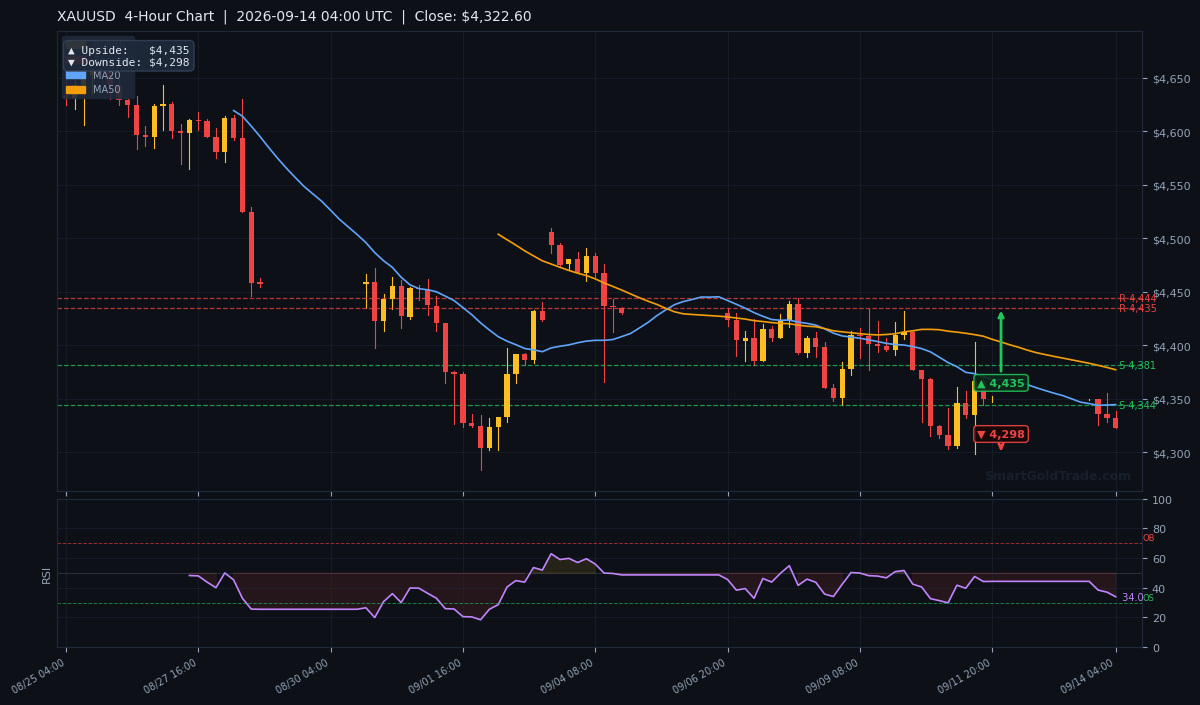
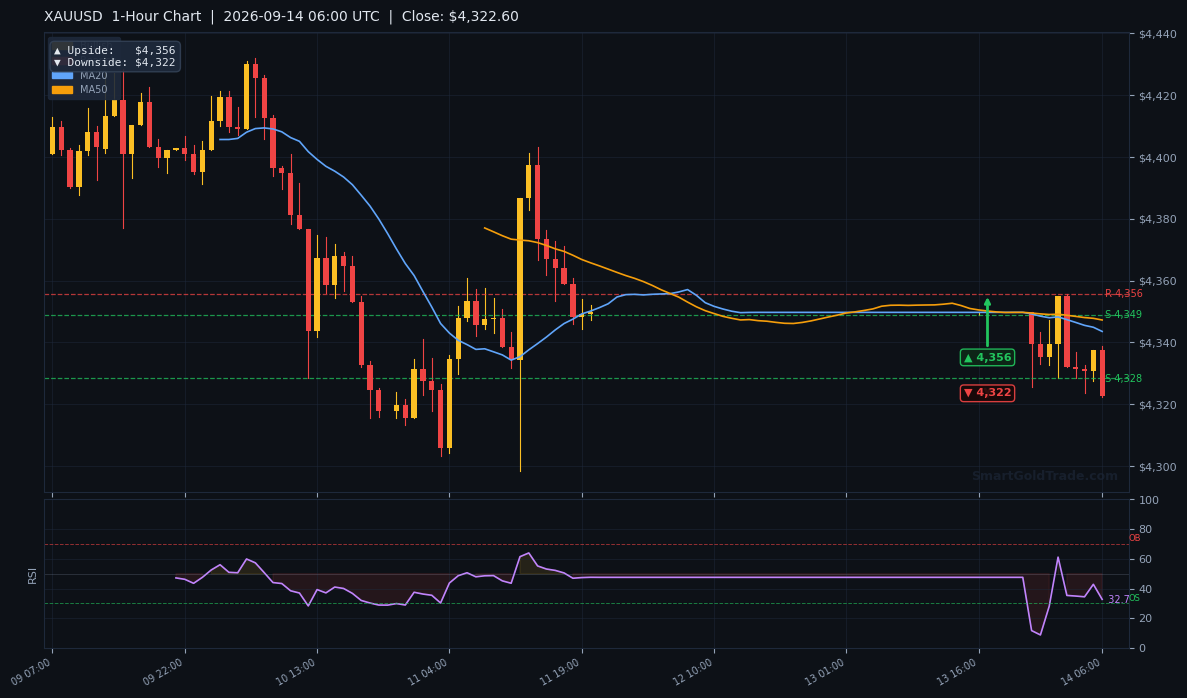
| Timeframe | Upside Target | Downside Target |
|---|---|---|
| Daily | $4,632 | $4,314 |
| 4-Hour | $4,435 | $4,298 |
| 1-Hour | $4,356 | $4,322 |
Fundamental Drivers
Friday's US CPI report is the dominant driver. Headline inflation held at 3.4% year-on-year, while core CPI rose 0.3% month-on-month against a 0.2% forecast. That upside surprise, combined with last week's hot PPI, has forced markets to price a near-certain Fed hike on Wednesday.
The dollar's three-day rally reflects this hawkish repricing. Rising Treasury yields are pulling capital away from gold. The inverse correlation between DXY and the gold price is doing the heavy lifting right now.
Philippine and Saudi gold prices both fell on Monday according to FXStreet data, confirming the global downtrend in local currency terms. This is a dollar-driven move, not a demand collapse.
Key Event to Watch
Wednesday's FOMC decision is the week's pivotal event. An 87% probability of a quarter-point hike is already priced, so the real risk is the dot plot and Powell's tone. A hawkish surprise could push the gold price toward $4,298; a softer-than-expected stance would likely spark a sharp rally toward $4,362.
Traders running automated strategies may want to consider a news event trading protection tool to pause positions during the FOMC release.
Devil's Advocate
The bearish bias could invalidate fast. Stochastic at 14.3/21.1 is deeply oversold, and a bounce from $4,324 is entirely plausible. If price reclaims $4,344 and holds above the EMA20, the bearish structure weakens.
A daily close above $4,362 would flip the short-term trend bullish and open $4,373. The key reversal level to watch is $4,324 — a clean break below it confirms the downside, while a strong rejection there sets up a squeeze toward $4,356.
Position sizing matters here. The tight range means stops should respect the ATR of $18.93.
Trading Strategy for European Session
The primary setup is a short from the $4,344–$4,356 resistance zone, with a stop above $4,373 and a target at $4,324. This aligns with the bearish EMA stack and the daily EMA200 support zone.
For a long scalp, wait for a confirmed bounce off $4,324 with a stop below $4,311 and a target at $4,356. Risk-reward is roughly 1:2 in both cases. Use the ATR of $18.93 to size stops appropriately.
If price breaks $4,324 with volume, the next target is $4,298, matching the 4-hour downside pivot. A break above $4,362 targets $4,371 and then $4,402.
For traders building longer-term exposure to the metal, halal gold trading offers a riba-free, no-leverage way to own spot gold by the gram without CFD risk.
Those who prefer to follow experienced positioning can explore copy trading to mirror top gold traders automatically.
Key Takeaways
- Gold price at $4,337.40, trapped between $4,324 support and $4,362 resistance.
- Price below EMA20 $4,344.37, EMA50 $4,356.11, and EMA200 $4,399.80 — bear structure confirmed.
- RSI at 46.1 neutral; Stochastic at 14.3 oversold, hinting at a possible bounce.
- Fed rate hike odds at 87% for Wednesday, capping gold upside via dollar strength.
- ATR of $18.93 implies a session range of roughly 0.44%.
- Break below $4,324 opens $4,298; reclaim of $4,344 targets $4,362.
Conclusion
The gold price bias remains cautiously bearish while below the EMA200 at $4,399.80. The immediate battle is at $4,324 — a level that has held for three sessions but is under mounting pressure from a hawkish Fed and a rising dollar.
Momentum is neutral, which means the next directional move will likely be triggered by a level break rather than an indicator signal. Watch $4,324 for a breakdown and $4,344 for a reversal confirmation.
Ahead of Wednesday's FOMC, expect choppy, range-bound trade between $4,324 and $4,362. The breakout, when it comes, should be decisive. Position accordingly and respect the ATR-based stop distances.
Frequently Asked Questions
- What is the gold price right now?
- The gold price is $4,337.40 in the European session, down 0.03% on the day and pinned just above the $4,324 support cluster.
- Will gold break below $4,324 today?
- A break below $4,324 would open $4,298, the 4-hour downside pivot. Stochastic is oversold, so a bounce is possible first, but the bearish EMA structure favors the downside.
- What is the key resistance for gold this session?
- Immediate resistance is R1 at $4,362.06, followed by R2 at $4,371.84. The H4 EMA200 at $4,373.75 reinforces this zone.
- How will the Fed decision affect the gold price?
- An 87% probability of a quarter-point hike is priced. A hawkish dot plot could send gold toward $4,298, while a dovish surprise could spark a rally to $4,362 and beyond.
- Is now a good time to buy gold?
- With price below all key EMAs and RSI neutral, waiting for a confirmed bounce off $4,324 or a reclaim of $4,344 offers a better risk-reward than buying into the current chop.
Trading Gold (XAU/USD) carries significant risk of loss and is not suitable for all investors. This content is for informational purposes only and does not constitute financial advice. Always conduct your own research and trade responsibly.