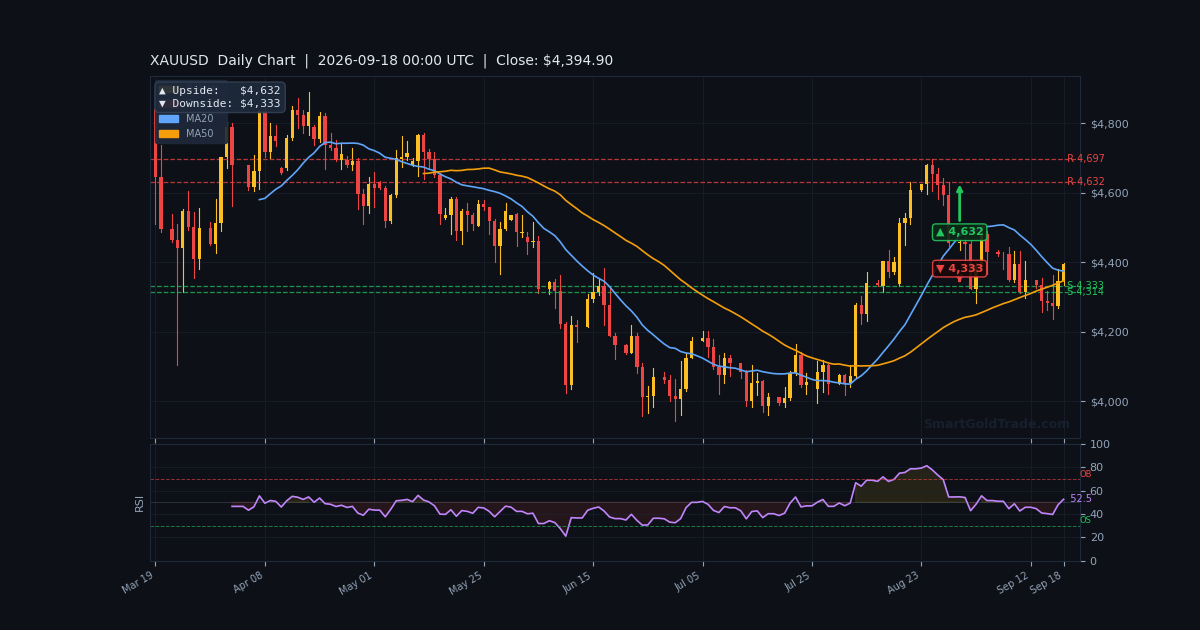
The gold price is holding firm at $4,377.51 as the European session opens, with bulls defending territory above the critical EMA200 at $4,350.74. Friday's Asian trade extended this week's rally, pushing XAU/USD to a fresh intraday high near $4,381.07 before consolidating. The metal has gained 0.79% today and 0.89% this week, building on momentum from last week's softer US inflation data that reinforced expectations for a more accommodative Fed stance.
Traders returning to desks in London face a market coiled for a breakout. The ADX reading of 31.0 confirms a strong trending environment, while the ATR of $18.33 suggests an active hourly range ahead. With key resistance at $4,398 firmly in sight, the question is whether European buyers can sustain the push or whether Asian profit-taking will cap gains. This session sets the tone for Friday's close and next week's open.
Gold Market Overview
Macro Context
The US Dollar Index remains under pressure following last week's inflation print, which came in below consensus expectations. Softer price data has revived bets on earlier Fed rate cuts, weakening the greenback and lending support to dollar-denominated gold. US Treasury yields have also eased from recent highs, reducing the opportunity cost of holding non-yielding bullion.
Geopolitical risk continues to simmer in the background. Persistent tensions in the Middle East and ongoing uncertainty around global trade policy keep a safe-haven bid intact. Central bank demand remains a structural tailwind, with emerging-market institutions continuing to diversify reserves into gold. For those seeking exposure to physical metal, SmartGoldTrade offers certified gold coins and bars with transparent pricing.
Session Outlook
European liquidity arrives with the market in a constructive posture. The London open typically brings increased volume and sharper directional moves, particularly when Asian ranges are tight. Expect volatility to pick up as European desks position ahead of the US session.
The immediate focus is the $4,381 level — Thursday's high and current R1 pivot. A clean break above this zone opens the door to $4,397 and the psychological $4,400 handle. To the downside, $4,375 and $4,377 form a tight support cluster that must hold to preserve bullish momentum.
Technical Analysis
Moving Average Structure
The moving average configuration remains decisively bullish. Price at $4,377.51 trades above the EMA20 at $4,349.02, the EMA50 at $4,333.53, and the critical EMA200 at $4,350.74. This alignment — with shorter-term averages above longer-term ones — confirms a healthy uptrend structure.
On the higher timeframes, the H4 EMA200 sits at $4,361.54, while the D1 EMA200 rests at $4,320.06. Price holding above all these levels reinforces the bullish case and suggests dips are likely to be bought.
RSI and Momentum
Momentum indicators paint a constructive but not overextended picture. The RSI(14) reads 63.6, placing it in neutral territory with room to run before hitting overbought conditions at 70. The Stochastic oscillator shows 74.7/53.7, indicating bullish crossover momentum without extreme readings.
The MACD at 11.32 with a positive histogram of +0.90 confirms underlying buying pressure. Together, these readings suggest the trend has legs, though traders should watch for any bearish divergence if price stalls at resistance.
Key Price Levels
Support levels are well-defined: S2 at $4,375.16 and S1 at $4,377.36 form the immediate floor. Resistance stands at R1 $4,381.07 and R2 $4,397.06. The Bollinger Bands span $4,385.22 (upper), $4,352.74 (middle), and $4,320.26 (lower), with price trading in the upper half — a sign of strength.
The VWAP at $4,355.57 provides additional support on any pullback. Given the ATR of $18.33, expect an hourly range of approximately $4,368 to $4,395 during the European session.
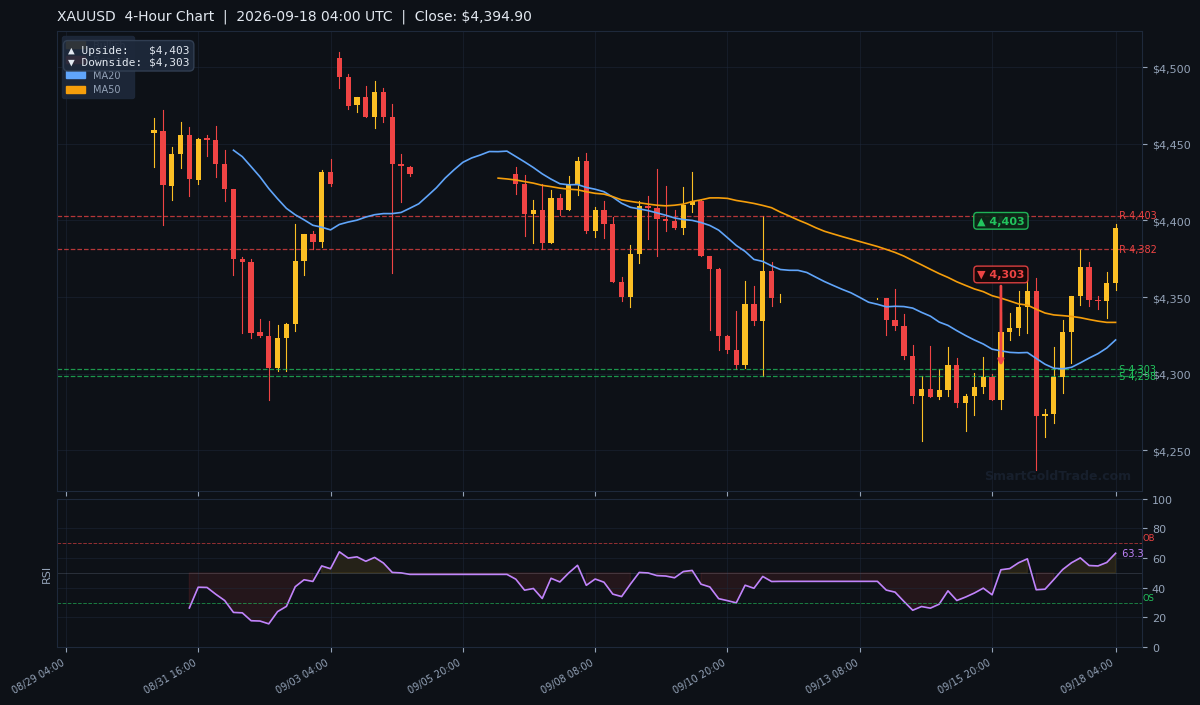
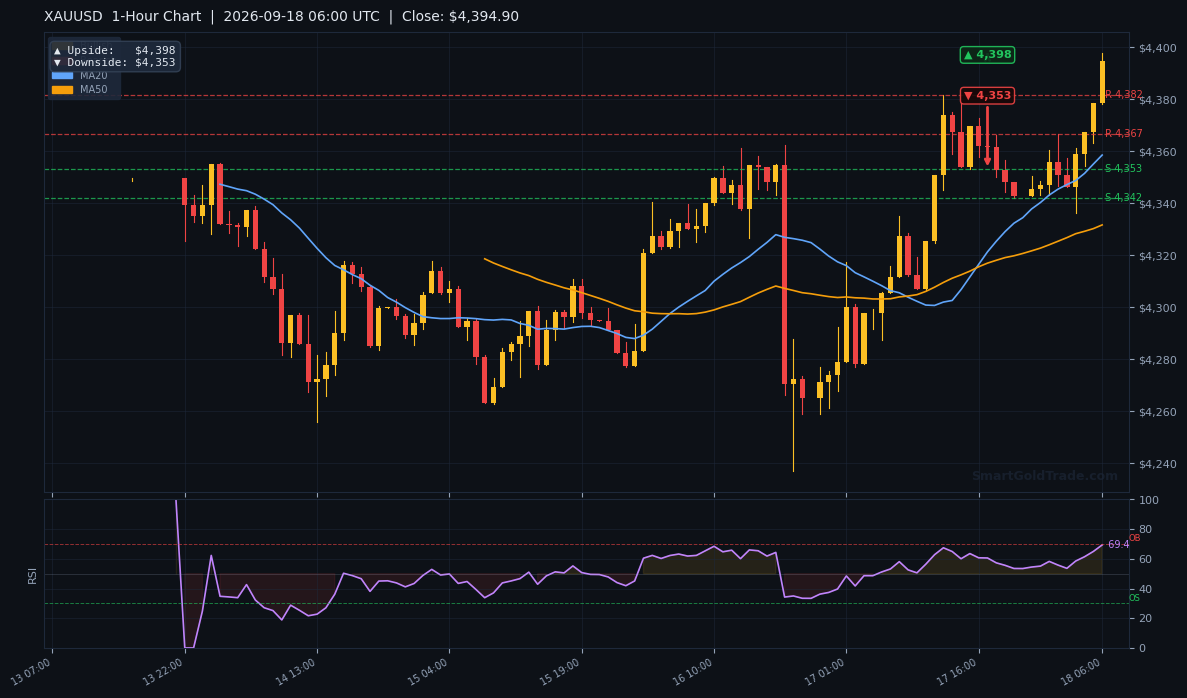
| Timeframe | Upside Target | Downside Target |
|---|---|---|
| Daily | $4,632 | $4,333 |
| 4-Hour | $4,403 | $4,303 |
| 1-Hour | $4,398 | $4,353 |
Fundamental Drivers
Gold prices rose across Asian markets on Friday, according to FXStreet data. In the Philippines, the metal climbed to 8,790.82 PHP per gram, up from Thursday's 8,750.04 PHP. Similar gains were recorded in Saudi Arabia, Malaysia, India, and Pakistan — a broad-based move reflecting the underlying dollar weakness and renewed safe-haven demand.
The Fed's positioning remains the dominant macro driver. Last week's softer inflation reading has shifted the narrative toward potential rate cuts, a scenario that historically benefits gold. Lower rates reduce the appeal of yield-bearing assets and weaken the dollar, both of which support bullion.
Key Event to Watch
With no major US data releases scheduled for Friday, attention turns to next week's calendar. Traders will monitor Fed speakers and any updates on the geopolitical front. The next significant catalyst will be the upcoming FOMC meeting, where policymakers will update their economic projections. Any dovish signals could accelerate gold's advance toward $4,400 and beyond.
Devil's Advocate
The bullish case is compelling, but risks remain. The RSI at 63.6 is approaching overbought territory, and a failure to break $4,381 could trigger profit-taking. If price slips below S1 at $4,377.36 and then S2 at $4,375.16, the bullish structure would weaken.
A sustained break below the EMA200 at $4,350.74 would flip the bias to neutral and expose the EMA50 at $4,333.53. Traders should watch for any hawkish Fed commentary that could strengthen the dollar and pressure gold. The key reversal level to monitor is $4,375 — losing this zone would signal a shift in momentum.
Trading Strategy for European Session
The primary strategy is to buy dips toward the $4,375–$4,377 support cluster, which aligns with S1 and S2 pivot levels. This zone also sits just above the VWAP at $4,355.57, adding confluence.
Entry: Long positions in the $4,375–$4,377 zone on a bullish reversal candle.
Stop Loss: Below $4,365, respecting the ATR of $18.33 and allowing room for normal volatility.
Take Profit 1: $4,397 (R2 pivot and 1-hour chart upside target).
Take Profit 2: $4,403 (4-hour chart upside target).
For those looking to automate entries and exits, professional gold trading signals can provide real-time alerts with defined risk parameters.
Risk-reward on this setup is approximately 1:1.5 to the first target and 1:2 to the second. If price breaks and holds above $4,381 with volume, a momentum continuation trade toward $4,398 is also viable, with a tight stop below $4,375.
Key Takeaways
- Gold price trades at $4,377.51, up 0.79% today and 0.89% this week.
- Price holds above all key moving averages — EMA20 $4,349.02, EMA50 $4,333.53, EMA200 $4,350.74.
- Immediate resistance at $4,381.07 (R1); a break targets $4,397.06 (R2).
- Support cluster at $4,375.16–$4,377.36 (S2/S1) must hold to preserve bullish bias.
- ADX at 31.0 confirms strong trend; ATR of $18.33 implies an active session range.
- DXY weakness and Fed rate-cut expectations remain key fundamental tailwinds.
Conclusion
The gold price enters the European session with a constructive technical posture and supportive fundamentals. Trading above all major moving averages and with momentum indicators in bullish alignment, the path of least resistance remains higher. The immediate hurdle is $4,381, and a clean break opens the door to $4,397 and potentially $4,403.
However, traders must respect the $4,375 support zone. A failure to hold this level would signal caution and shift focus to the EMA200 at $4,350.74. For now, the bias is bullish, and dips toward support are likely to attract buyers. Keep position sizes disciplined and watch for volatility as London and New York sessions overlap.
Frequently Asked Questions
- What is the gold price right now?
- The gold price is $4,377.51 as of the European session open on September 18, 2026.
- What are the key resistance levels for gold today?
- Immediate resistance stands at $4,381.07 (R1), followed by $4,397.06 (R2) and the 1-hour chart target of $4,398.
- What support levels should I watch?
- Key support is at $4,377.36 (S1) and $4,375.16 (S2). A break below could expose the EMA200 at $4,350.74.
- Is gold in an uptrend?
- Yes, gold trades above its EMA20, EMA50, and EMA200, with ADX at 31.0 confirming a strong trend.
- What could reverse the bullish bias?
- A sustained break below $4,375 would weaken the structure, while a drop under $4,350.74 would flip the bias to neutral.
Risk Disclaimer: Trading Gold (XAU/USD) carries significant risk of loss and is not suitable for all investors. This content is for informational purposes only and does not constitute financial advice. Always conduct your own research and trade responsibly.