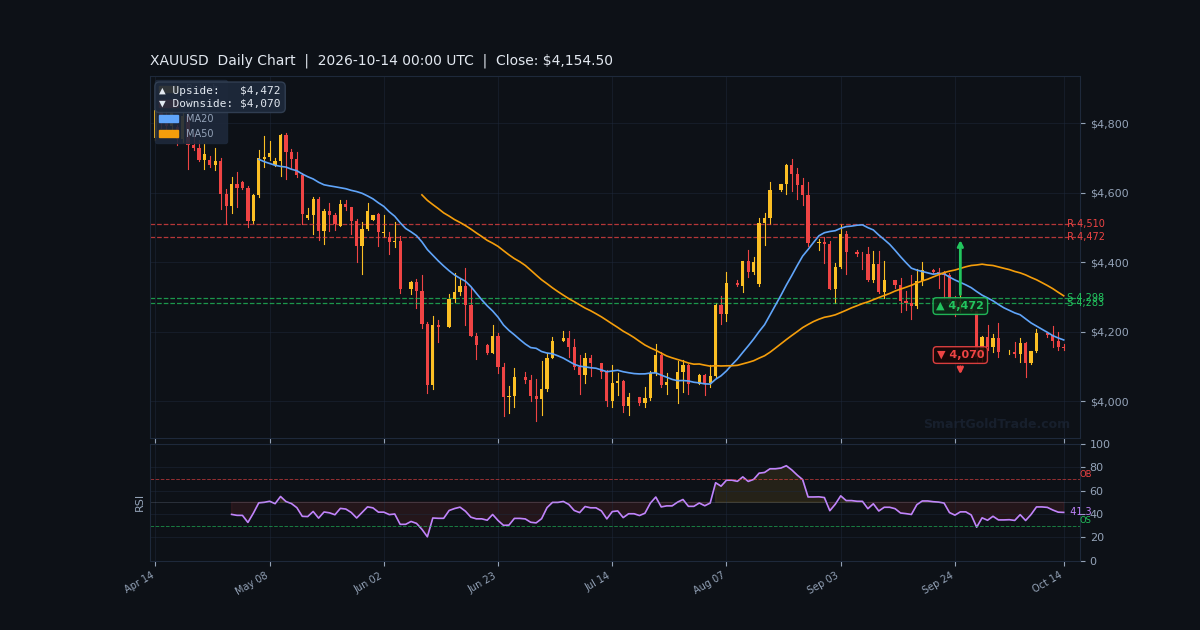
The gold price is testing a critical inflection point at $4,155.11 during Wednesday's Asian session, with bears pressing against a support zone that has held for three consecutive sessions. Tuesday's New York Fed President John Williams remarks — signaling one more rate hike this year but none in 2027 — sent mixed signals through the dollar complex, yet gold failed to capitalize. With US CPI data due later today, the metal sits below its EMA200 at $4,171.45, a bearish structural signal that demands respect. This session will likely set the tone for the CPI reaction: either a defense of $4,150 or a breakdown toward $4,147.
Gold Market Overview
Macro Context
The US Dollar Index remains elevated near 18-month highs, though Williams' dovish 2027 outlook triggered a modest pullback in two-year Treasury yields. Lower yields typically support gold, but the metal has failed to rally meaningfully — a sign of underlying weakness. Markets price a 77.3% chance the Fed holds rates this month, but an 87.8% probability of a December hike keeps the dollar bid.
Geopolitical risk from Middle East tensions — Houthi missile strikes on Saudi Arabia — has lifted oil prices, fueling inflation concerns. Rising oil often pressures gold when central banks respond with tighter policy. The IMF's warning on elevated public debt adds another layer of uncertainty, though haven't translated into safe-haven gold demand this week.
Session Outlook
Asian session liquidity is thin, as always before a major US data release. Expect range-bound action between $4,150 and $4,170 until European desks arrive. The ATR(14) at $10.88 suggests an expected hourly range of roughly $11 — modest by recent standards. Do not chase moves in this environment; let the CPI release provide direction.
Technical Analysis
Moving Average Structure
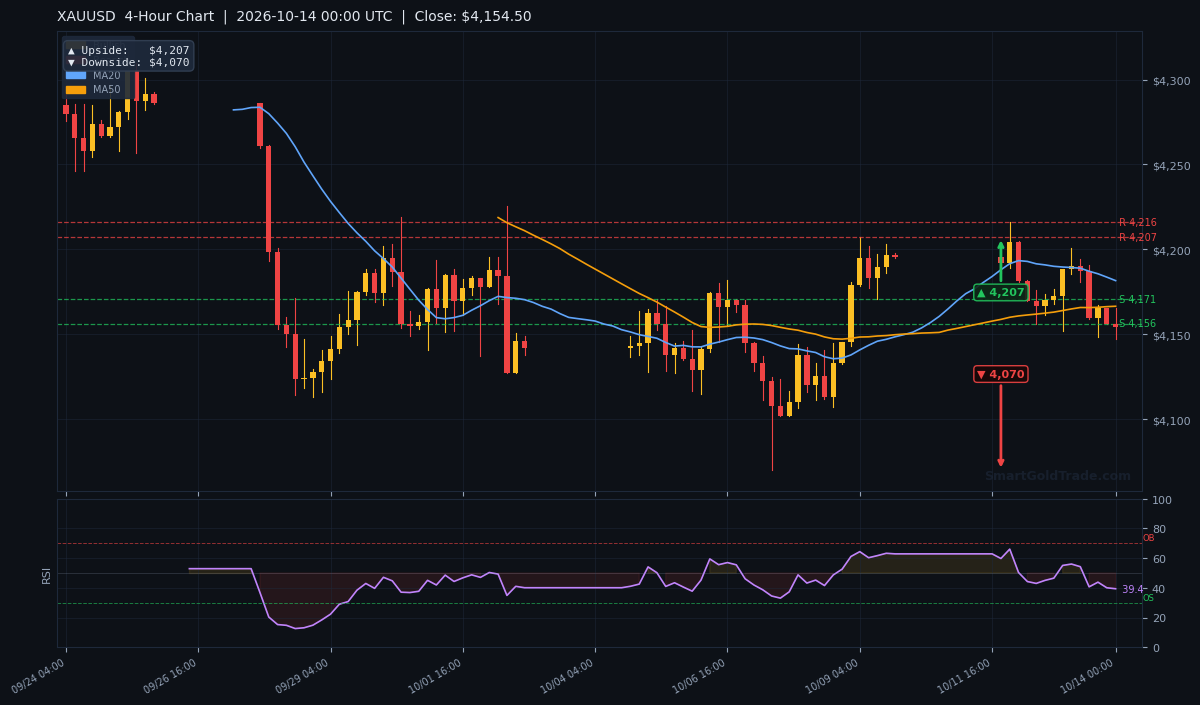
The EMA20 at $4,165.37, EMA50 at $4,169.73, and EMA200 at $4,171.45 are stacked in bearish alignment above the current gold price of $4,155.11. This configuration — price below all three key moving averages — confirms the short-term trend remains down. The H4 EMA200 at $4,249.52 and D1 EMA200 at $4,299.39 reinforce the broader bearish structure.
RSI and Momentum
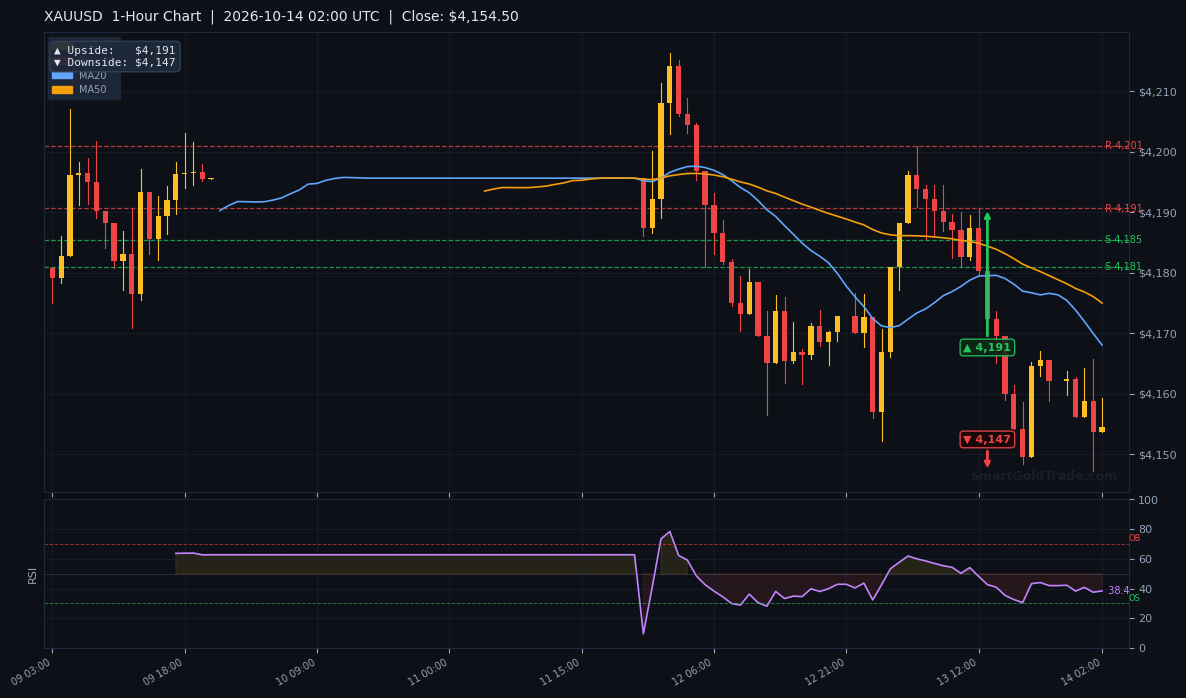
The RSI(14) reads 38.8 — neutral but leaning toward oversold territory. This is not yet a buy signal; RSI can remain depressed for extended periods in trending markets. The Stochastic at 20.2/23.0 is approaching oversold, suggesting a short-term bounce is possible, but the MACD at -5.99 with a negative histogram of -1.39 confirms bearish momentum remains intact. ADX at 27.2 indicates a strong trend — respect it.
Key Price Levels
Immediate support rests at S1 $4,154.73, just below the current gold price. A break here opens S2 $4,150.79 and the prior day low at $4,147.00. To the upside, R1 $4,170.44 caps any recovery, with R2 $4,179.69 as the next hurdle. The Bollinger Bands at $4,141.57 (lower) and $4,198.80 (upper) frame the broader range.
| Timeframe | Upside Target | Downside Target |
|---|---|---|
| Daily | $4,472 | $4,070 |
| 4-Hour | $4,207 | $4,070 |
| 1-Hour | $4,191 | $4,147 |
Fundamental Drivers
China's CPI for September came in at 0.9% YoY, missing the 1.0% expectation, while PPI jumped 5.0% — above the 4.5% consensus. The PPI beat signals pipeline inflation pressures that could keep global central banks hawkish. For gold, this is a headwind: higher inflation expectations typically mean higher rates, which raise the opportunity cost of holding non-yielding assets.
Fed's Williams struck a notably dovish tone on 2027 policy, but the market isn't buying it yet. CME FedWatch shows an 87.8% probability of a December hike. Until that narrative shifts, gold rallies will likely be sold.
Key Event to Watch
Today's US CPI release is the single most important catalyst this week. Headline inflation is expected at 3.6% YoY, up from 3.4% prior, with core at 2.5%. A hotter print would reinforce the December hike narrative and likely push gold toward $4,147 or lower. A softer print could trigger a relief rally toward $4,170.
Devil's Advocate
The bearish case rests on price being below the EMA200 and MACD momentum. But the RSI at 38.8 and Stochastic near 20 suggest sellers may be exhausted. If gold reclaims $4,170 on a closing basis, the bearish structure weakens significantly. A break above $4,179.69 would flip the short-term bias to neutral and open the door to $4,191. Watch for a false breakdown below $4,147 followed by a sharp reversal — that would trap shorts and fuel a squeeze.
Trading Strategy for Asian Session
Given thin liquidity and the looming CPI release, patience is the trade. Aggressive entries in this environment invite slippage and whipsaws.
Short Setup: Consider selling rallies into $4,165–$4,170 if price rejects the EMA cluster. Stop loss at $4,182 (above R2, roughly 1.5x ATR). First target $4,154, second target $4,147.
Long Setup: If $4,150.79 (S2) holds on an hourly close, a scalp long toward $4,165 is viable. Stop at $4,144 (below PDL). This is counter-trend — size accordingly.
For those seeking to automate entries and exits around these levels, professional gold trading signals can provide real-time alerts when key levels break. If you prefer holding physical metal as a longer-term hedge against the inflation pressures building in the pipeline, purchase physical gold directly from our certified inventory. For traders who want to build a position gradually without leverage, halal gold trading offers spot ownership by the gram from $1.
Key Takeaways
- Gold price at $4,155.11 sits below all three key EMAs — bearish structure intact.
- RSI at 38.8 is neutral, not oversold — room for further downside.
- Critical support at $4,150.79 (S2); a break targets $4,147.
- Resistance at $4,170.44 (R1) caps recovery attempts.
- ATR of $10.88 suggests modest hourly ranges — don't chase.
- US CPI today is the week's biggest catalyst — expect volatility.
Conclusion
The gold price enters the Asian session on the defensive, trapped below its EMA200 and vulnerable to further weakness. The bearish case is supported by MACD momentum and the broader H4/D1 structure, but the RSI and Stochastic suggest a bounce is possible before the next leg lower. The key level to watch is $4,150.79 — a clean break opens $4,147, while a reclaim of $4,170 would neutralize the immediate bearish bias. With CPI on deck, expect the real move to come during the US session. Stay patient, respect the range, and let the data provide direction.
Frequently Asked Questions
- What is the gold price right now?
- As of the Asian session on October 14, 2026, the gold price is $4,155.11, down 0.14% from the daily open of $4,161.08.
- Is gold bullish or bearish right now?
- Short-term bearish. The price trades below the EMA20 ($4,165.37), EMA50 ($4,169.73), and EMA200 ($4,171.45), with MACD at -5.99 confirming downward momentum.
- What are the key support and resistance levels for gold today?
- Support sits at $4,154.73 (S1) and $4,150.79 (S2). Resistance is at $4,170.44 (R1) and $4,179.69 (R2).
- How will US CPI data affect the gold price?
- A hotter-than-expected CPI (above 3.6% YoY) would reinforce December rate hike bets and likely push gold toward $4,147. A softer print could trigger a rally toward $4,170.
- What is the expected trading range for gold this session?
- With ATR(14) at $10.88, expect an hourly range of roughly $11. The broader session range is likely between $4,147 and $4,170 until CPI.
Trading Gold (XAU/USD) carries significant risk of loss and is not suitable for all investors. This content is for informational purposes only and does not constitute financial advice. Always conduct your own research and trade responsibly.