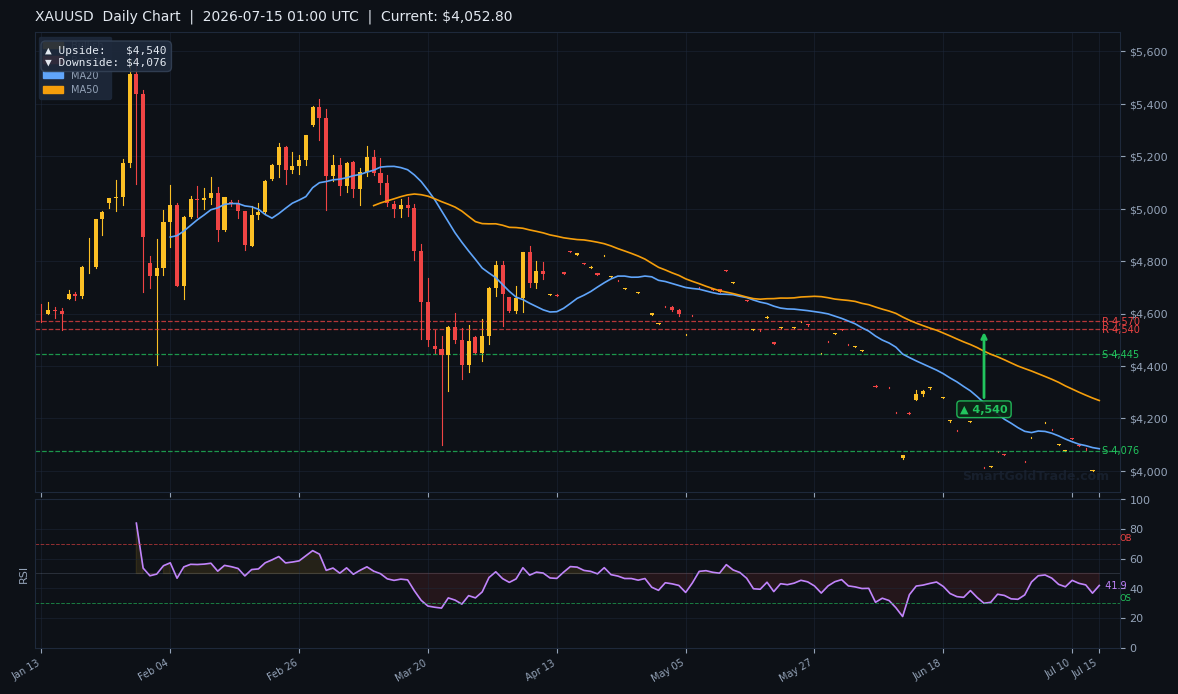
Gold price is trading near $4,033.23 early Wednesday, extending its break below the $4,047 support level during thin Asian-hour liquidity. Singapore’s Q2 GDP data met expectations at 1.1% quarter-on-quarter, but the release failed to stir the calm waters. Traders now face a critical question: can the gold price reclaim the broken $4,164 support-turned-resistance before Thursday’s US retail sales report? Overnight, the metal printed a session low around $4,033 before stabilising slightly — a level that mirrors the bearish momentum building on the H4 chart. The overall tone remains cautious, with sellers in control and volumes light. This session is about setup, not execution. We examine the chart structure and the one event that could spark the next move.
Gold Price Overview
Macro Context
The US Dollar Index is consolidating near 103.50 while the 10-year Treasury yield hovers around 3.85%, offering no decisive push for the gold price. Last week’s softer US CPI and PPI reports briefly lifted XAUUSD toward $4,200, but the rally stalled and reversed, reinforcing the bearish undertone. The in-line Singapore GDP print — 1.1% quarter-on-quarter — did little to alter regional risk appetite, leaving the gold price to follow technical flows. Meanwhile, Fed funds futures continue to price in a single rate cut later this year, a scenario that has already been mostly absorbed by the market and therefore provides limited fresh impetus for gold bulls.
Session Outlook
Asian hours are notorious for tight ranges and false breaks, and today’s average true range of $15.17 suggests any intraday move will likely stay confined to a $4,020–$4,050 band. With liquidity draining from early Asian desks, the risk of a sudden spike or sharp reversal on a headline cannot be ignored. Traders should avoid chasing any pre-London breakout and instead focus on fading extremes near well-defined technical levels. The true directional trigger arrives on Thursday with the US retail sales report; until then, the gold price is likely to drift sideways, testing the patience of both bulls and bears.
Technical Analysis
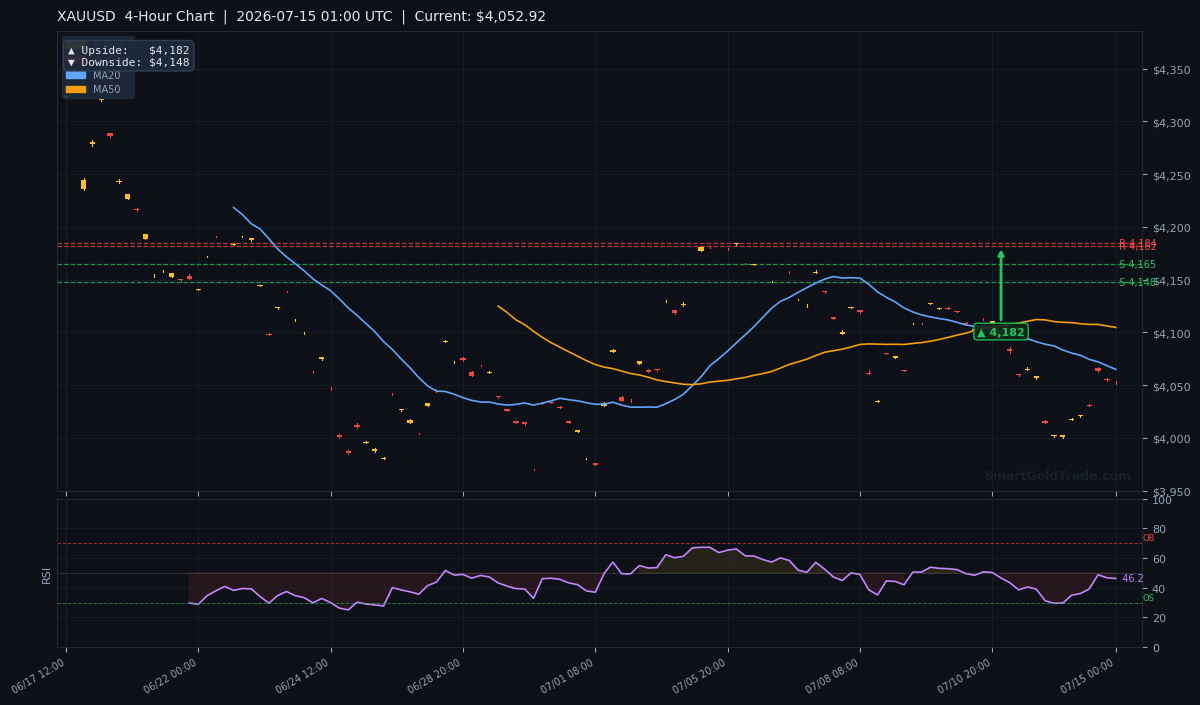
Our H4 technical panel, drawn from earlier live data, paints a bearish picture. While the snapshot showed gold at $4,052.92, the price action has since deteriorated, and the gold price now sits at $4,033.23, firmly below its 20-period simple moving average (MA20) of $4,064.96, the 50-period (MA50) of $4,104.73, and the 200-period (MA200) at $4,200.89. This “three crows” alignment — price below all major moving averages — remains a classic bearish configuration.
Moving Average Structure
The short-term trend is confirmed by the MA20 sitting below the MA50, creating a short-term bearish pressure environment. For the bulls to regain credibility, they must push the gold price back above the MA20 at $4,064.96 and, more importantly, reclaim the MA50 at $4,104.73 — a tall order without a fundamental catalyst. The widening gap to the $4,200.89 MA200 illustrates how far the gold price has to travel to reenter a longer-term bullish channel.
RSI and Momentum
The 14-period Relative Strength Index (RSI) read 46.3 earlier, squarely in neutral territory. Neither oversold nor overbought conditions were flashing at that time, signalling that bears still had room to run. This neutral reading suggested the gold price could consolidate or continue its grind lower. The eventual break below $4,047 validates that outlook, and a further drop below 40 on the RSI would signal accelerating downside momentum, potentially opening a quick leg toward the $4,000 psychological handle.
Key Price Levels
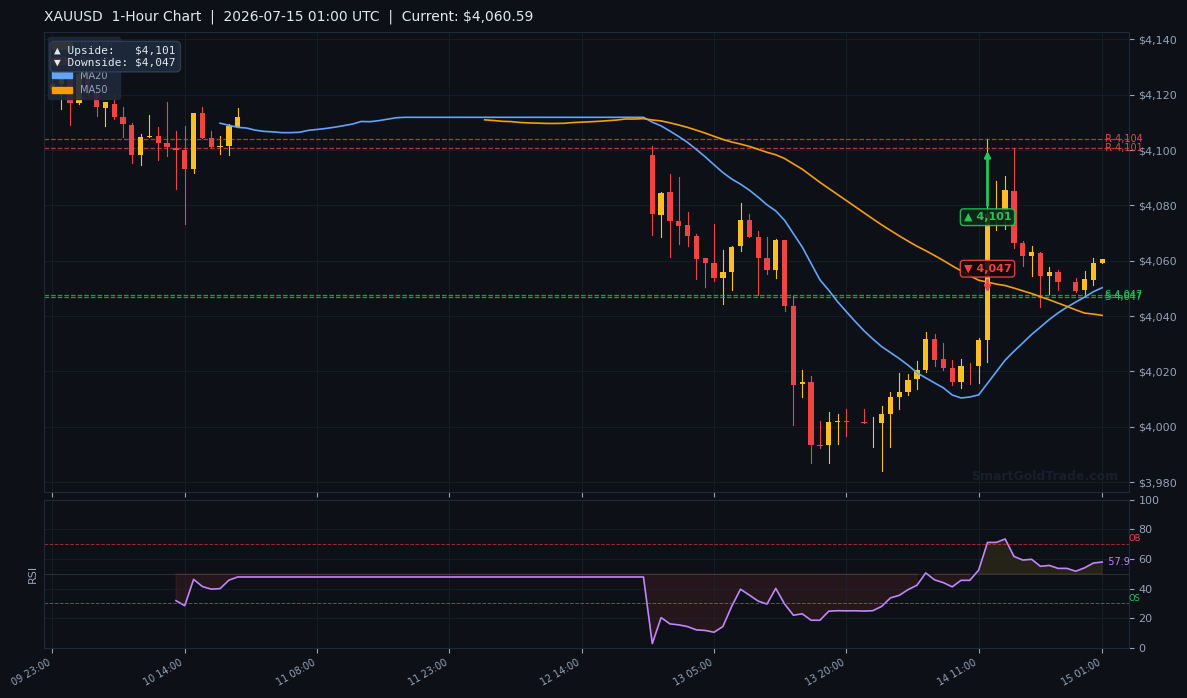
With the gold price now trading below $4,147.61 (the former S2 support) and $4,164.51 (S1), both levels have firmly flipped into resistance. The immediate downside risk has already materialised with the break of the 1-hour pivot at $4,047; further selling targets the daily bearish pivot of $4,076 — though interestingly that level now sits above the current price and will act as a magnet if a corrective bounce materialises. On the upside, any gold price recovery back above $4,147 could trigger a squeeze toward $4,164 and then $4,184.32 (R1 resistance). A second resistance — $4,181.55 (R2) — lies just below R1, forming a tight cluster that will be difficult to breach without a catalyst. The daily chart’s larger-scale bullish target remains $4,540, but that dream is far off unless the metal can first recover $4,200.
Fundamental Drivers
Monday’s Singapore Q2 GDP print offered no surprise, leaving the gold price without an Asian economic jolt. The real driver this week will be Thursday’s US retail sales figures for June, which could redefine rate cut expectations. A weaker-than-expected reading would likely lift the gold price as a hedge against economic softening, while a robust print would reinforce the dollar and keep gold pinned below $4,100. Adding to the mix, geopolitical tensions in the Middle East remain a latent background risk, though they have failed to generate sustained safe-haven flows in the current environment.
Key Event to Watch
Thursday’s US retail sales report and the accompanying Philadelphia Fed manufacturing index are the marquee events. Markets expect a modest 0.3% month-on-month increase; a miss below 0.0% could trigger a sharp dollar selloff, propelling the gold price back toward the $4,164 resistance. Conversely, a beat above 0.5% would likely cement the bearish case and drive price toward the recently broken $4,047 pivot with conviction. For traders seeking real-time guidance around such high-impact releases, professional gold trading signals can provide expert-analysed entry and exit levels. Until then, position sizing should be light, and risk management tight.
Devil’s Advocate
A daily close above the broken support-turned-resistance at $4,164.51 would invalidate the near-term bearish thesis and shift focus to $4,184. Such a move could materialise if Thursday’s retail sales print is shockingly weak or if an unexpected