Gold Price at $3,573.29: Bears Target $3,514.67 Support in NY Session
The gold price is trading at $3,573.29 as the American Session gets underway, down 1.53% from today's open at $3,628.91. This follows last week's hawkish Fed minutes that reinforced expectations for a December rate hike.
Gold has now shed 7.58% this week, marking its worst weekly performance since March. The sell-off accelerated during Asian trading, where spot gold hit its lowest level since September 2025 before finding temporary footing.
With the 10-year Treasury yield slipping below 5% and the dollar hesitating below 104, traders are watching whether $3,514.67 becomes the next bearish target or a springboard for a relief rally this session.
Gold Market Overview
Macro Context
The macro backdrop remains firmly bearish for the gold price. The broad dollar index sits at 122.7, up 1.1% week-over-week, while the 10-year TIPS real yield has climbed to 2.88% — a direct headwind for non-yielding bullion.
SPDR GLD holdings fell 6.0 tonnes yesterday, reflecting institutional outflows. Meanwhile, CFTC data shows speculators still net long 190,107 contracts, leaving room for further liquidation if prices break lower.
Fed positioning has shifted decisively hawkish. Markets now price a full 25-basis-point hike in December, with nearly 70% odds of another move in January. Philadelphia Fed President Anna Paulson and Chicago Fed President Austan Goolsbee both voiced concerns about persistent inflation on Thursday.
Session Outlook
The American Session brings the final University of Michigan consumer sentiment report, including inflation expectations — a key input for Fed policy. Remarks from Fed Governor Lisa Cook are also scheduled.
Liquidity should improve as New York desks come online, but with ADX at 54.8 signaling a strong trend, expect volatility.
Technical Analysis
Moving Average Structure
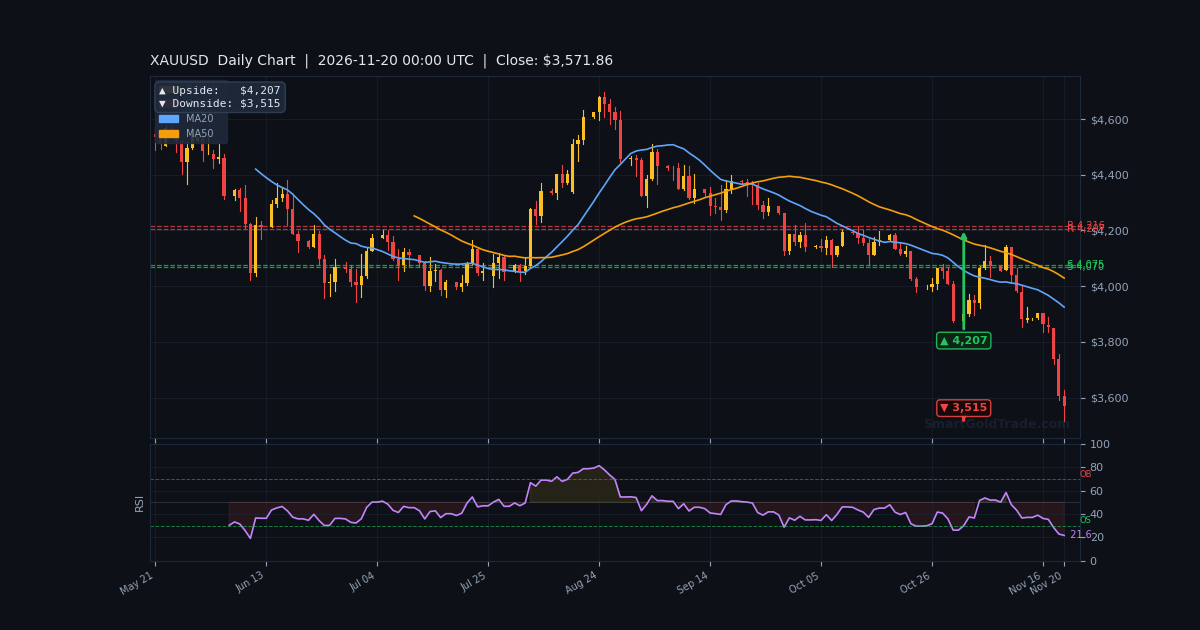
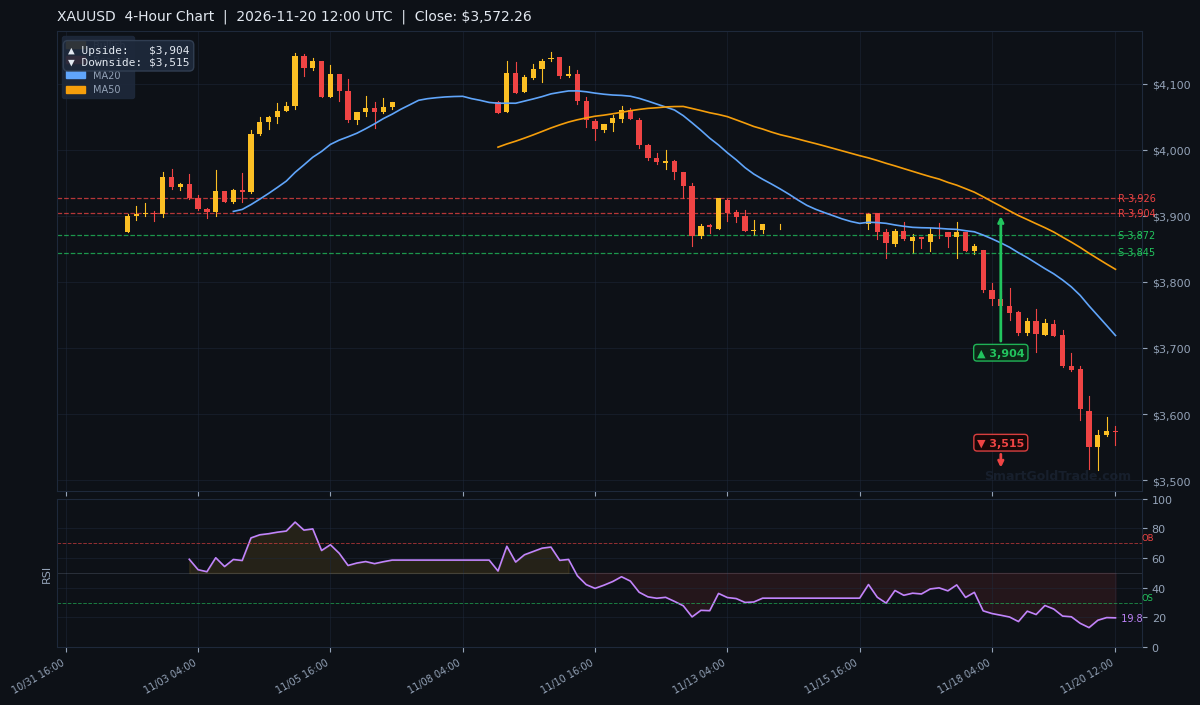
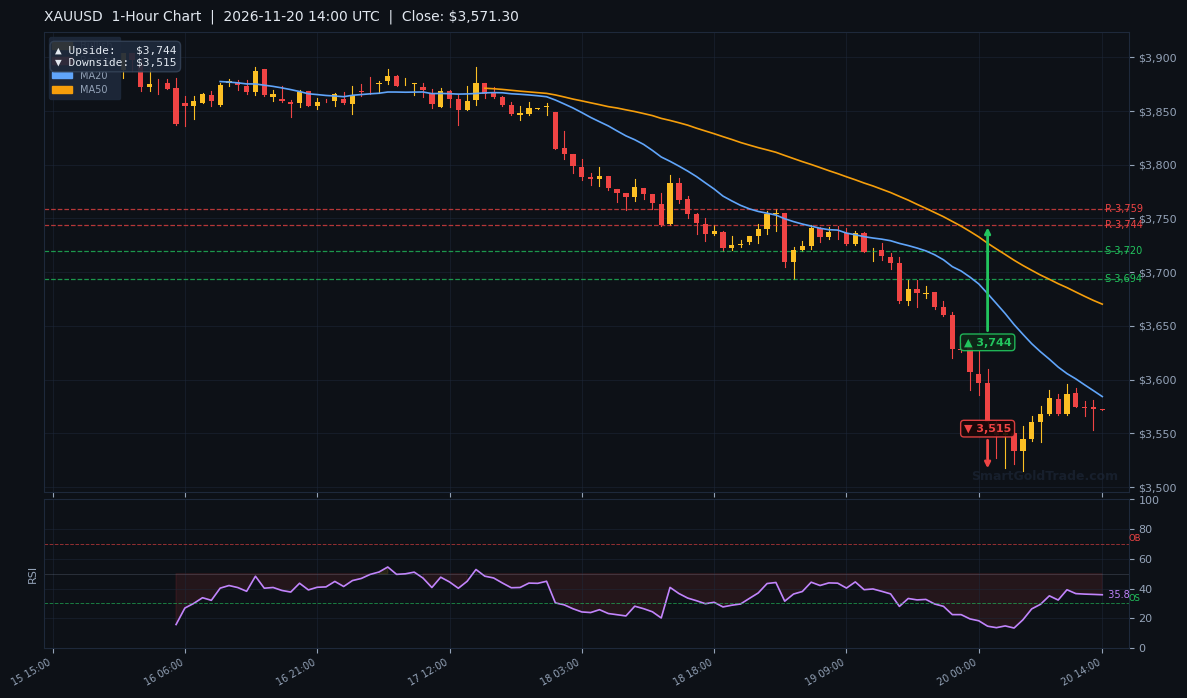
The EMA20 at $3,600.91, EMA50 at $3,668.71, and EMA200 at $3,830.19 are stacked bearishly above the current gold price. Price trades well below all three, confirming a sustained downtrend.
On the H4 chart, the close at $3,573.32 sits far below the EMA50 at $3,816.70 and EMA200 at $4,004.25. The daily chart tells the same story — price is 12% below its EMA50 at $4,049.49.
RSI and Momentum
The H1 RSI(14) reads 36.0, firmly in neutral territory but leaning bearish. On the H4 and D1 timeframes, RSI sits at 22.0 and 24.3 respectively — deep oversold conditions that often precede short-term bounces.
The MACD histogram is positive at +5.28, suggesting bearish momentum is decelerating. Stochastic readings at 44.8/41.1 show no extreme signal, leaving room for either direction.
Key Price Levels
Immediate support rests at S1 $3,514.67, which aligns with the pivot arrow downside target of $3,514.67 across all timeframes. A break below opens the door to deeper losses.
Resistance is layered at R1 $3,758.56 (also the prior day high) and R2 $3,790.54. The 61.8% Fibonacci retracement at $3,607.84 sits just above current price as near-term resistance.
The VWAP at $3,567.29 is essentially at current price, indicating fair value for the session so far.
Fundamental Drivers
The dominant theme is the Fed's hawkish pivot. This week's October minutes showed broad support for faster tightening, and markets now price back-to-back hikes in December and January. Higher rates raise the opportunity cost of holding gold.
Global equities are in a sharp sell-off — the Nasdaq is down over 6% this week — forcing liquidation across asset classes. Gold is being sold to raise cash, not because its fundamentals improved.
The dollar remains elevated near 19-month highs, though it has hesitated below 104.00 as AI stock jitters offset rate hike bets. A sustained dollar pullback would give gold room to bounce.
Key Event to Watch
The University of Michigan inflation expectations reading, due later today, is the session's key catalyst. A hotter-than-expected print would reinforce hawkish Fed bets and likely push the gold price toward $3,514.67. A softer reading could spark a relief rally toward $3,600.91.
Unified Technical & Fundamental Outlook
Both pillars are aligned bearish. The technical score of -0.75 reflects the broken moving average structure and strong ADX trend. The fundamental score of -0.52 captures rising real yields, dollar strength, and GLD outflows.
The combined assessment is BEARISH at -0.64 with ALIGNED_BEARISH status. This is a high-conviction setup where technicals and fundamentals reinforce each other.
The one caveat: oversold RSI on H4 and D1 timeframes. While alignment is bearish, the market may need to consolidate or bounce before the next leg lower. Traders should respect the trend but manage entries carefully.
Devil's Advocate
What could invalidate the bearish bias? A decisive reclaim of $3,607.84 — the 61.8% Fibonacci level — would signal buyers are stepping in. Above that, $3,628.91 (today's open) becomes the next test.
The cross-asset sell-off could also reverse quickly if equities stabilize. Gold's correlation to risk assets has been unusually high during this liquidation phase.
A dovish surprise from Fed Governor Cook's remarks, or a soft inflation expectations print, could trigger short-covering.
Trading Strategy for American Session
For bearish traders, the ideal entry is a bounce toward $3,600.91–$3,607.84 (EMA20 and Fibonacci confluence), with a stop above $3,628.91 (daily open). Target $3,514.67 as the primary downside objective, with a secondary target at $3,499.14.
Aggressive traders can sell at current price $3,573.29 with a stop at $3,600.91 and target $3,514.67 — a 1:2 risk-reward setup.
For contrarian bulls, a long entry near $3,514.67 with a stop at $3,499.14 and target $3,600.91 offers a favorable risk-reward if support holds. However, this trades against the dominant trend and requires tight risk management.
Position sizing should account for the ATR of $25.84 — stops need at least $30 of room to avoid noise. The ADX at 54.8 confirms strong trend conditions, so counter-trend trades carry higher risk.
Key Takeaways
- Gold price at $3,573.29 is down 1.53% today and 7.58% this week — worst weekly drop since March.
- Technical and fundamental pillars are aligned bearish with a combined score of -0.64.
- Key support at $3,514.67 is the make-or-break level for bears; a break targets $3,499.14.
- Immediate resistance at $3,607.84 (61.8% Fibonacci) caps any bounce attempts.
- Oversold RSI at 22.0 on H4 and 24.3 on D1 warns of potential short-term relief rallies.
- Real yields at 2.88% and dollar at 122.7 remain structural headwinds for the gold price.
Conclusion
The gold price faces a critical test at $3,514.67 as the American Session unfolds. With both technicals and fundamentals aligned bearish, the path of least resistance remains lower.
However, deeply oversold conditions on higher timeframes suggest a bounce could come first. The key is to watch how price reacts at $3,514.67 — a clean break signals continuation, while a bounce opens the door to $3,600.91. The Fed's hawkish stance and rising real yields remain the dominant drivers for the gold price heading into year-end.
Frequently Asked Questions
- What is the gold price right now?
- The gold price is $3,573.29 as of the American Session open, down 1.53% from today's open of $3,628.91.
- Why is gold falling today?
- Gold is under pressure from hawkish Fed expectations, with markets pricing a December rate hike. Rising real yields at 2.88% and dollar strength at 122.7 are weighing on the gold price.
- What is the key support level for gold?
- The critical support is $3,514.67 (S1). A break below this level would target $3,499.14 and signal further downside for the gold price.
- What is the next resistance level for gold?
- Immediate resistance sits at $3,607.84 (61.8% Fibonacci), followed by $3,628.91 (daily open) and $3,758.56 (R1).
- Is gold oversold?
- Yes, on higher timeframes. The H4 RSI is at 22.0 and D1 RSI at 24.3 — both deeply oversold. This suggests a relief rally is possible before further downside.
Risk Disclaimer: Trading Gold (XAU/USD) carries significant risk of loss and is not suitable for all investors. This content is for informational purposes only and does not constitute financial advice. Always conduct your own research and trade responsibly.