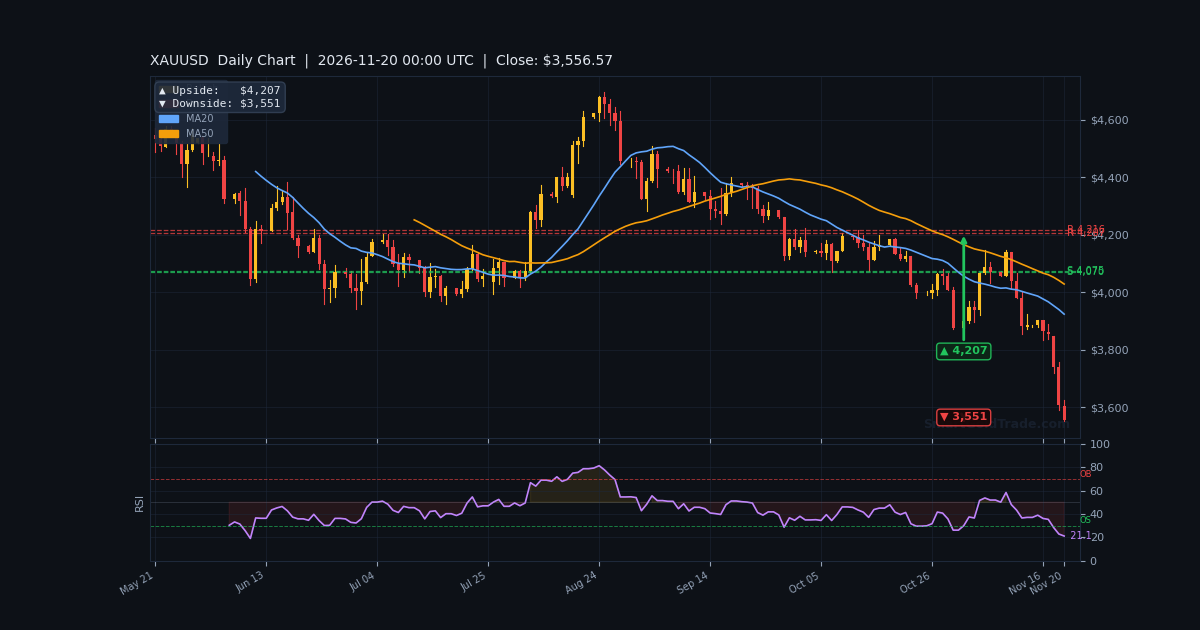
The gold price is trading at $3,560.15 in the Asian session, down a staggering 1.90% today and 7.92% for the week. This is a market in full-blown capitulation mode, with the metal now sitting just $3 above the critical S1 support at $3,556.97. The trigger for this latest leg lower was last week's hawkish FOMC minutes, which revealed that almost all Fed officials expect rates to move higher to combat rising inflation risks.
This morning, Japan's national CPI came in at 2.3% year-over-year, reinforcing global rate-hike expectations and keeping pressure on non-yielding assets. With the dollar index surging to 122.7 and real yields climbing to 2.88%, the fundamental backdrop remains deeply hostile to gold. This session is about one thing: whether the $3,556.97 support holds or breaks, setting the stage for the next major move.
Gold Market Overview
Macro Context
The macro environment for gold is about as bearish as it gets. The broad dollar index has risen 1.1% this week to 122.7, while 10-year TIPS real yields have climbed to 2.88%, up 0.10% week-over-week. Higher real yields increase the opportunity cost of holding gold, and the market is now pricing in a 97.3% probability of a 25-basis-point Fed rate hike in December, according to the CME FedWatch tool.
Adding to the bearish case, SPDR GLD holdings dropped another 4.6 tonnes yesterday to 1044.1 tonnes, signalling continued institutional outflows. The only glimmer of hope is that COT data shows speculators remain net long by 190,107 contracts, but this positioning is now underwater and could fuel further selling if stops are triggered. News sentiment is firmly negative at -0.48, reflecting the hawkish tilt.
Session Outlook
The Asian session is likely to see thin liquidity, which can exaggerate price swings. With the gold price hovering just above the $3,556.97 support, traders should watch for a potential oversold bounce, but any rally will likely be capped by the $3,594.48 VWAP and the $3,609.76 H1 high. The key trigger this session is whether the $3,556.97 level holds; a break below could accelerate selling toward the daily downside target of $3,556.97.
Technical Analysis
Moving Average Structure
The moving average structure is unambiguously bearish. On the H1 chart, the gold price is trading far below the EMA20 at $3,669.56, the EMA50 at $3,726.38, and the EMA200 at $3,861.24. The EMA20 is also below the EMA50, confirming a downtrend. On the higher timeframes, the H4 close at $3,560.78 is well below the H4 EMA50 at $3,848.19, and the D1 close is below the D1 EMA50 at $4,048.99. This alignment across all timeframes indicates that the path of least resistance remains lower.
RSI and Momentum
The RSI(14) on the H1 chart is at 15.2, which is deeply oversold territory. This suggests that a short-term bounce is possible, but it is not a buy signal in a strong downtrend. The Stochastic oscillator is at 6.8/6.6, also oversold, while the MACD histogram is negative at -11.37, with the MACD line at -40.17 below its signal line at -28.80. The ADX is at 48.7, indicating a very strong trend, with the -DI at 42.66 far above the +DI at 4.55, confirming that bears are in full control.
Key Price Levels
The immediate support is the S1 level at $3,556.97, which coincides with the session low. A break below this level would expose the daily downside target of $3,556.97. On the upside, resistance is at the R1 level of $3,758.56, but this is far away. More immediate resistance is the VWAP at $3,594.48 and the H1 open at $3,597.12. The ATR(14) is $25.49, suggesting an expected hourly range of about 0.72% of the price, so a move of $25 in either direction is normal for this session. Last week's FOMC minutes showed that almost all officials saw rising inflation risks that may warrant a more aggressive tightening cycle. Fed Governor Christopher Waller added fuel to the fire by suggesting the central bank may need to respond more aggressively to rising prices. This has led markets to price in a near-certain rate hike in December.
Yesterday's U.S. weekly jobless claims rose to 203k, but the market largely ignored this as the focus remains on inflation and Fed policy. The stronger dollar, which is up 1.1% this week, is also weighing on gold, as is the rise in real yields. The geopolitical risk premium has also faded, with hopes of Middle East de-escalation reducing safe-haven demand. According to OCBC analysts, "concerns over AI spending, a hawkish shift in Fed expectations and hopes of Middle East de-escalation have triggered sharp moves across markets."
Key Event to Watch
There are no high-impact USD events scheduled for today, but traders will closely monitor any Fed speak for further clues on the pace of tightening. The most important upcoming event is the December FOMC meeting, where a rate hike is almost fully priced in. Any hints of a larger 50-basis-point move would be extremely bearish for gold.
Unified Technical & Fundamental Outlook
Both the technical and fundamental pillars are bearish and aligned. The technical score is -0.92, with the H1 trend bearish and price below all key moving averages. The fundamental score is -0.55, driven by rising real yields, a stronger dollar, and GLD outflows. The combined assessment is bearish with a score of -0.73, and the alignment is ALIGNED_BEARISH. This means that both chart-based and macro-based signals point to further downside, though the deeply oversold RSI suggests a potential short-term bounce. Traders should not fight the trend but be aware of the risk of a relief rally.
Devil's Advocate
The main risk to the bearish bias is an oversold bounce. The RSI at 15.2 is extremely low, and the gold price is sitting just above a major support level at $3,556.97. If this support holds, a short-covering rally could push the price back toward the VWAP at $3,594.48 or even the H1 high at $3,609.76. A break above the $3,609.76 level would invalidate the immediate bearish setup and suggest a deeper correction. Additionally, if there is any unexpected dovish commentary from Fed officials or a sudden flare-up in geopolitical tensions, gold could spike higher.
Trading Strategy for Asian Session
Given the bearish alignment, the strategy is to sell rallies, but with caution due to oversold conditions. The ideal entry zone is near the VWAP at $3,594.48 to $3,597.12, where sellers may step in. A stop loss should be placed above the H1 high at $3,609.76, perhaps at $3,620.07, which is about 0.7x the ATR from entry. The first take profit is the S1 support at $3,556.97, and the second target is the daily downside level at $3,556.97. For those looking to trade the bounce, a long position could be considered only if the price shows a clear reversal pattern above $3,556.97, with a tight stop below $3,556.97 and a target of $3,594.48. However, this is a counter-trend trade and carries higher risk. Position sizing should be conservative given the thin liquidity.
Key Takeaways
- Gold price is at $3,560.15, down 1.90% today and 7.92% for the week.
- Critical support at $3,556.97 (S1) is the line in the sand; a break targets $3,556.97.
- RSI at 15.2 is deeply oversold, but the trend remains strongly bearish with ADX at 48.7.
- Real yields at 2.88% and a rising dollar at 122.7 are major headwinds.
- Fed rate hike odds for December are at 97.3%, keeping pressure on gold.
- Any rally is likely capped at the VWAP of $3,594.48 and H1 high of $3,609.76.
Conclusion
The gold price is under severe pressure, trading at $3,560.15 and testing the critical $3,556.97 support level. The bearish alignment of technical and fundamental factors suggests that the path of least resistance remains lower, with a break below $3,556.97 opening the door to $3,556.97. However, the extremely oversold RSI warns of a potential bounce, so traders should be nimble and avoid chasing the market at these levels. The key level to watch is $3,556.97; a decisive break could trigger a cascade of selling, while a hold could lead to a relief rally toward $3,594.48. Stay patient and let the price action confirm the next move.
Frequently Asked Questions
- What is the current gold price?
- The gold price is currently $3,560.15 per ounce in the Asian session.
- What are the key support and resistance levels for gold?
- Immediate support is at $3,556.97 (S1) and $3,556.97. Resistance is at $3,594.48 (VWAP) and $3,758.56 (R1).
- Why is gold falling?
- Gold is falling due to hawkish Fed expectations, rising real yields (2.88%), a stronger dollar (122.7), and GLD outflows. The market is pricing a 97.3% chance of a December rate hike.
- Is it a good time to buy gold?
- With the RSI at 15.2, gold is oversold, but the trend is strongly bearish. Buying now is risky; wait for a confirmed reversal or a break below support to short.
- What is the next major event for gold?
- The December FOMC meeting, where a rate hike is almost fully priced in. Any hint of a larger hike would be bearish for gold.
Risk Disclaimer: Trading Gold (XAU/USD) carries significant risk of loss and is not suitable for all investors. This content is for informational purposes only and does not constitute financial advice. Always conduct your own research and trade responsibly.