Gold Price at $3,992: Oversold Bounce or Deeper Slide Ahead?
The gold price is trading at $3,992.12 in the Asian session, perched just above the critical $3,991.42 support level after a punishing week that erased 4.21% from the weekly open. This is the lowest print in more than two months, and the market is deeply oversold.
The trigger was a familiar one: escalating Middle East tensions sent oil surging, reviving inflation fears and hardening expectations that the Federal Reserve will keep rates higher for longer. Friday's Asian open followed Thursday's rout, with gold extending losses below $4,050 before finding tentative footing near $3,992.
With liquidity thin and the RSI(14) at 25.2, the question for Asian traders is whether this is a genuine exhaustion point or merely a pause before a deeper flush toward $3,989. The answer likely hinges on how price behaves around the $3,991 pivot in the next few hours.
Gold Market Overview
Macro Context
The macro backdrop remains hostile to the gold price. The dollar is firm, Treasury yields are elevated, and the Fed's hawkish posture under Chair Kevin Warsh has kept real yields positive — a structural headwind for a non-yielding asset.
Last month's rate hike was the first since 2023, and markets now assign a 92.8% probability of no change at the October meeting, per the CME FedWatch tool. That removes an immediate catalyst for dovish repricing. Meanwhile, UK CPI accelerated to 3.5% year-on-year in September, and Japan's core inflation hit 2.4% ex-food and energy — global price pressures are not retreating quietly.
Geopolitically, Houthi attacks on Saudi infrastructure, including a drone intercepted near Aramco's Shaybah field, have pushed oil higher. Normally a gold-positive risk event, this time it cuts both ways: energy-driven inflation supports the Fed's hawkish case, which in turn pressures gold.
Session Outlook
Asian session liquidity is thin, and the ATR(14) of $16.81 suggests an expected hourly range of roughly 0.42%. That means moves can look more dramatic than they are. Traders should expect choppy, two-way action between $3,991 and $4,015 (VWAP) unless a fresh headline lands.
The daily open at $4,027.50 is the first meaningful upside reference. A sustained reclaim would signal the oversold bounce has legs. Failure to hold $3,991 opens the door to the $3,989 downside pivot and potentially the June low zone near $3,960/3,940 flagged by Societe Generale.
Technical Analysis
Moving Average Structure
The trend is unambiguously bearish. The gold price at $3,992.12 sits well below the EMA20 at $4,049.95, the EMA50 at $4,083.30, and the EMA200 at $4,129.55. That stacked alignment — price below all three — confirms a downtrend, not a dip.
On the higher timeframes, the H4 EMA200 at $4,206.16 and the D1 EMA200 at $4,285.95 are far above, reinforcing that any bounce is counter-trend until proven otherwise. The ADX at 47.3 signals a strong trend — bounces in strong trends tend to be shallow and short-lived.
RSI and Momentum
The RSI(14) at 25.2 is firmly in oversold territory. The Stochastic at 7.6/7.8 is pinned near the floor, and the MACD at -24.80 with a histogram of -3.44 shows momentum still negative but flattening. This is the classic setup for a technical bounce — but oversold can stay oversold in a strong downtrend.
The H4 RSI at 22.1 and D1 RSI at 33.0 confirm the exhaustion is broad-based. For short-term traders, the signal is caution: chasing shorts at $3,992 offers poor risk-reward, while buying requires confirmation above $4,015.
Key Price Levels
Immediate support is S1 at $3,991.42 — price is literally sitting on it. A break targets the $3,989 downside pivot, then the $3,960/3,940 zone. Resistance begins at the VWAP of $4,015.19, then R1 at $4,127.01 and R2 at $4,141.99.
The Bollinger Bands ($4,111.02 upper / $4,054.01 mid / $3,996.99 lower) show price pressing the lower band — another oversold signal. The expected session range based on ATR is roughly $16–$17, so a move to $4,009 or $3,975 would be within normal parameters.
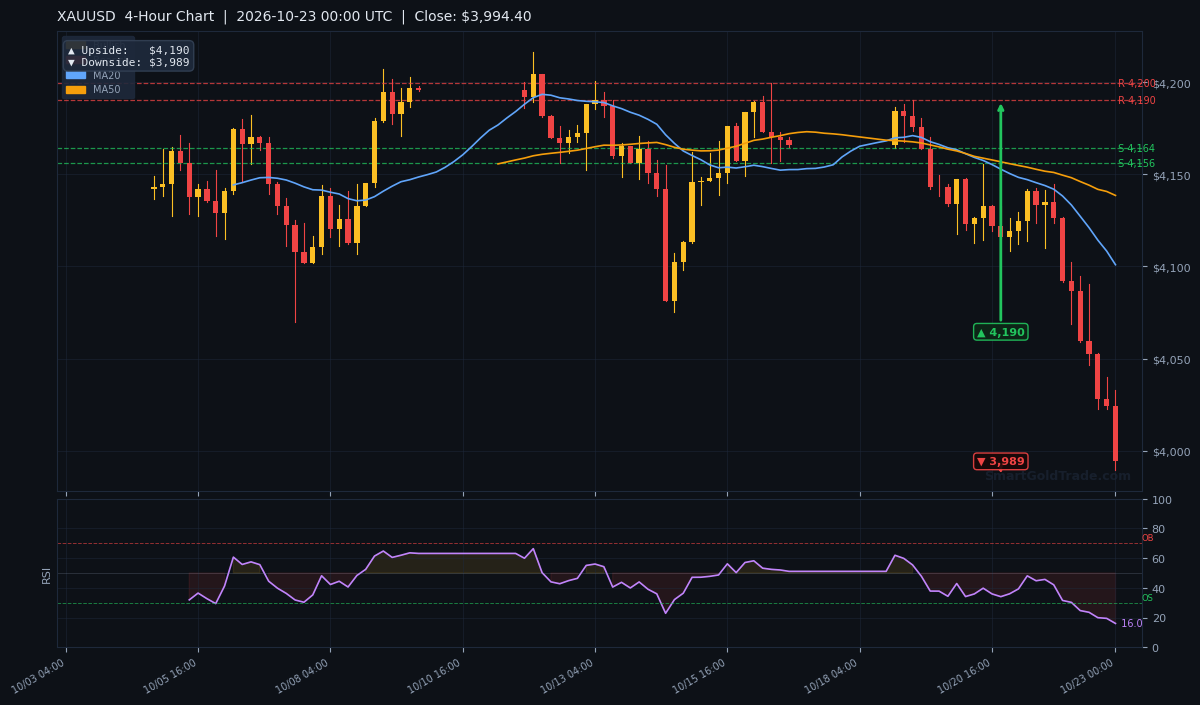
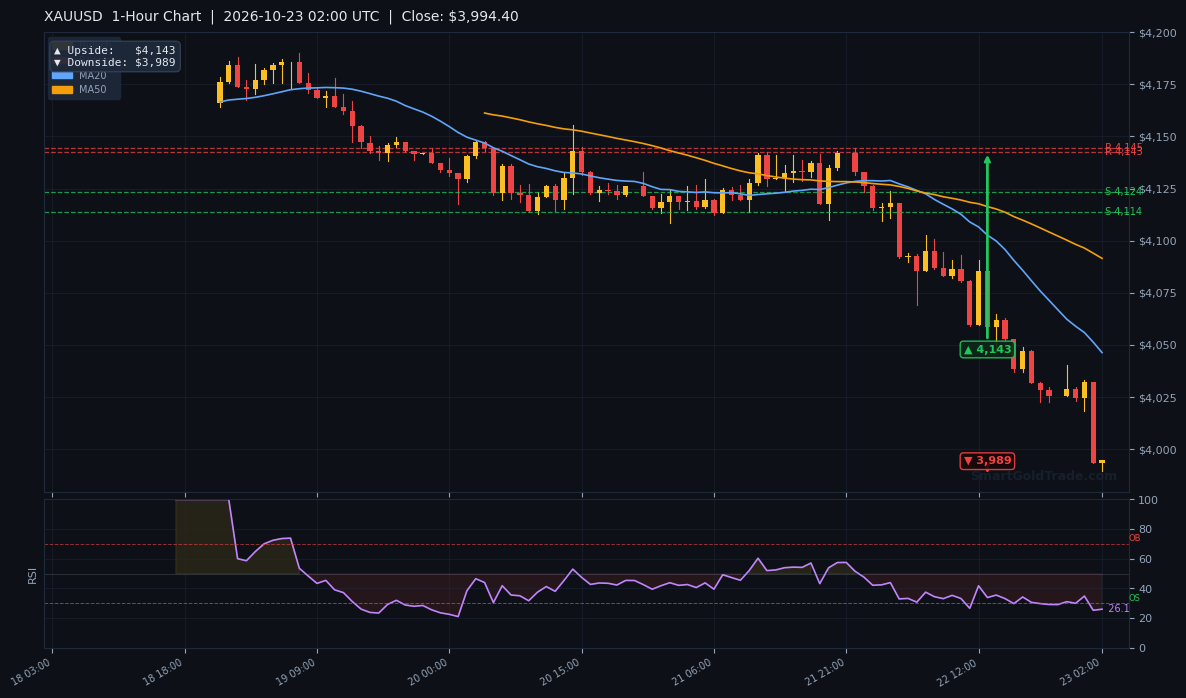
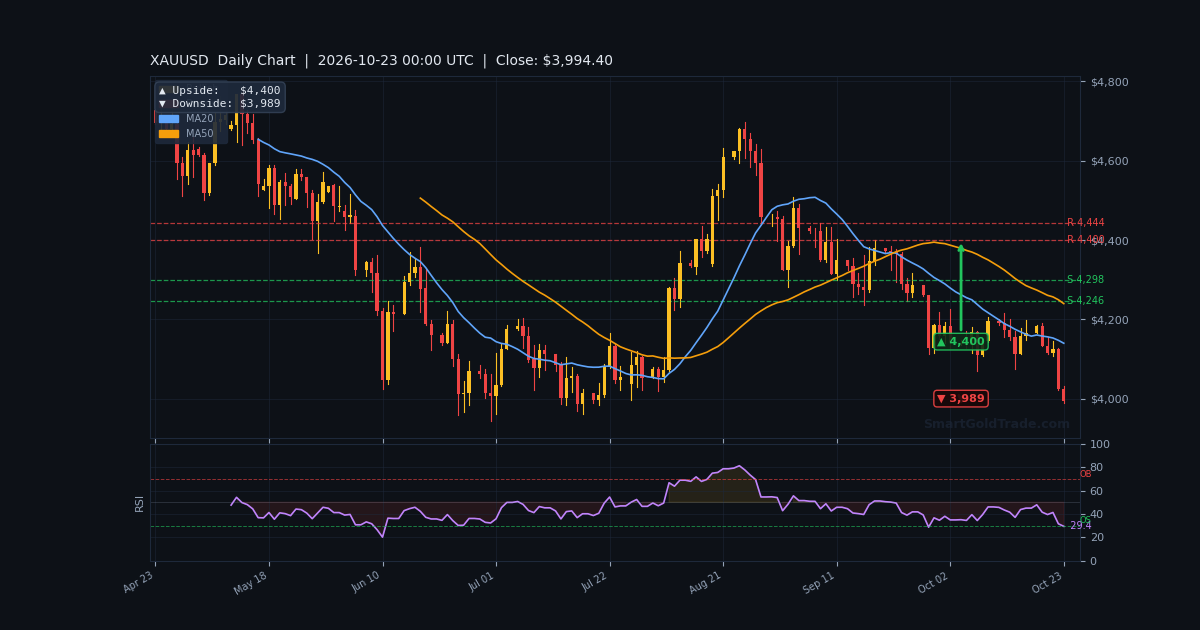
| Timeframe | Upside Target | Downside Target |
|---|---|---|
| Daily | $4,400 | $3,989 |
| 4-Hour | $4,190 | $3,989 |
| 1-Hour | $4,143 | $3,989 |
Fundamental Drivers
This morning's Japan inflation data confirmed the global price pulse is not fading. National CPI rose 2.1% year-on-year in September, while the core measure excluding fresh food and energy climbed 2.4% — the first exceedance of the BoJ's target in nine months. That supports a near-term BoJ hike and a stronger yen, which has pushed USD/JPY down 1% to 156.55.
For gold, a stronger yen is mildly supportive via a softer dollar, but the dominant driver remains the Fed. Chair Warsh's cautious tone last week — with a FXS Speechtracker score of 5.6/10 — kept options open but did nothing to soften the hawkish bias. The 92.8% probability of a hold in October means the market is not pricing a dovish pivot.
The oil spike from Saudi infrastructure attacks adds an inflationary impulse that complicates the Fed's path. Higher energy costs typically support gold as a hedge, but when they reinforce rate-hike expectations, the net effect can be negative — as this week demonstrated.
Key Event to Watch
The single most important event this week is Friday's US S&P Global Purchasing Managers Index preliminary reading. A soft print would revive growth concerns and could trigger a relief bounce in the gold price toward $4,015. A strong print reinforces the higher-for-longer narrative and keeps pressure on $3,991.
Devil's Advocate
The bearish case is straightforward: strong trend, price below all major EMAs, and a Fed unwilling to pivot. But the oversold reading is extreme, and the $3,991.42 support is holding on first test. If price reclaims $4,015 (VWAP) and holds above the daily open at $4,027.50, the short thesis weakens materially.
A break above $4,049.95 (EMA20) would flip the short-term structure to neutral and open $4,083 (EMA50). The key invalidation for bears is a daily close above $4,054 (Bollinger mid). Conversely, a clean break below $3,989 confirms the downtrend and targets $3,960.
Trading Strategy for Asian Session
Given thin liquidity and an oversold market sitting on support, the highest-probability approach is patience. Do not chase shorts at $3,992 — the risk of a violent squeeze toward $4,015 is too high. Equally, buying blindly into a strong downtrend is dangerous.
For a long setup, wait for a confirmed reclaim of $4,015 (VWAP) with a stop below $3,989 — roughly one ATR ($16.81) of risk. Target $4,049 (EMA20) as the first take-profit, with $4,083 as a stretch. Risk-reward is approximately 1:2.
For a short setup, the cleaner entry is a rejection at $4,015–$4,027 with a stop above $4,040. Target $3,991, then $3,960. If price breaks $3,989 decisively, a momentum short toward $3,960 is viable with a stop at $4,005. Avoid trading in the first hour of the session — spreads widen and false breaks are common.
For those who prefer automated execution during volatile news, a news event trading protection tool can pause strategies around high-impact releases. And if you are building a longer-term position in the metal itself, SmartGoldTrade offers a straightforward way to purchase physical gold at these lower prices.
Key Takeaways
- The gold price is at $3,992.12, down 4.21% on the week and sitting directly on S1 at $3,991.42.
- RSI(14) at 25.2 and Stochastic at 7.6 signal extreme oversold conditions — bounce risk is elevated.
- Price is below all major EMAs (20/50/200), confirming a bearish trend structure with ADX at 47.3.
- Key resistance: $4,015 (VWAP), $4,049.95 (EMA20), $4,127.01 (R1). Key support: $3,991.42, $3,989, $3,960.
- Japan CPI at 2.4% core and UK CPI at 3.5% reinforce global inflation, supporting the Fed's hawkish stance.
- Expected session range based on ATR(14) of $16.81 is roughly $16–$17 from current levels.
Conclusion
The gold price faces a binary decision at $3,991. The trend is bearish, the Fed is hawkish, and momentum remains negative — but the market is deeply oversold and sitting on a key support level. That combination argues for patience rather than aggression.
Asian session traders should watch $4,015 as the pivot. A reclaim opens a counter-trend bounce toward $4,049. A break of $3,989 confirms the downtrend and targets $3,960. With liquidity thin, the safest approach is to let the market show its hand before committing. The setup is forming — but it is not yet confirmed.
Frequently Asked Questions
- Is the gold price oversold enough to buy?
- The RSI(14) at 25.2 is deeply oversold, but in a strong downtrend (ADX 47.3), oversold can persist. A confirmed reclaim of $4,015 would be a better entry signal than buying blindly at $3,992.
- What is the key support level for gold right now?
- The immediate support is S1 at $3,991.42, where price is currently sitting. Below that, the $3,989 pivot and the $3,960/3,940 June low zone are the next major floors.
- What could trigger a bounce in the gold price?
- A soft US PMI print on Friday, a sudden drop in Treasury yields, or a fresh geopolitical escalation that drives safe-haven demand. A move above $4,015 (VWAP) would be the first technical confirmation.
- Where are the upside targets if gold rebounds?
- First target is $4,049.95 (EMA20), then $4,083.30 (EMA50). The 1-hour chart pivot targets $4,143, while the 4-hour target sits at $4,190.
- How does the Fed affect the gold price this week?
- Markets price a 92.8% chance of no rate change in October. Any hawkish surprise would pressure gold below $3,989; a dovish hint could spark a rally toward $4,049.
Risk Disclaimer: Trading Gold (XAU/USD) carries significant risk of loss and is not suitable for all investors. This content is for informational purposes only and does not constitute financial advice. Always conduct your own research and trade responsibly.