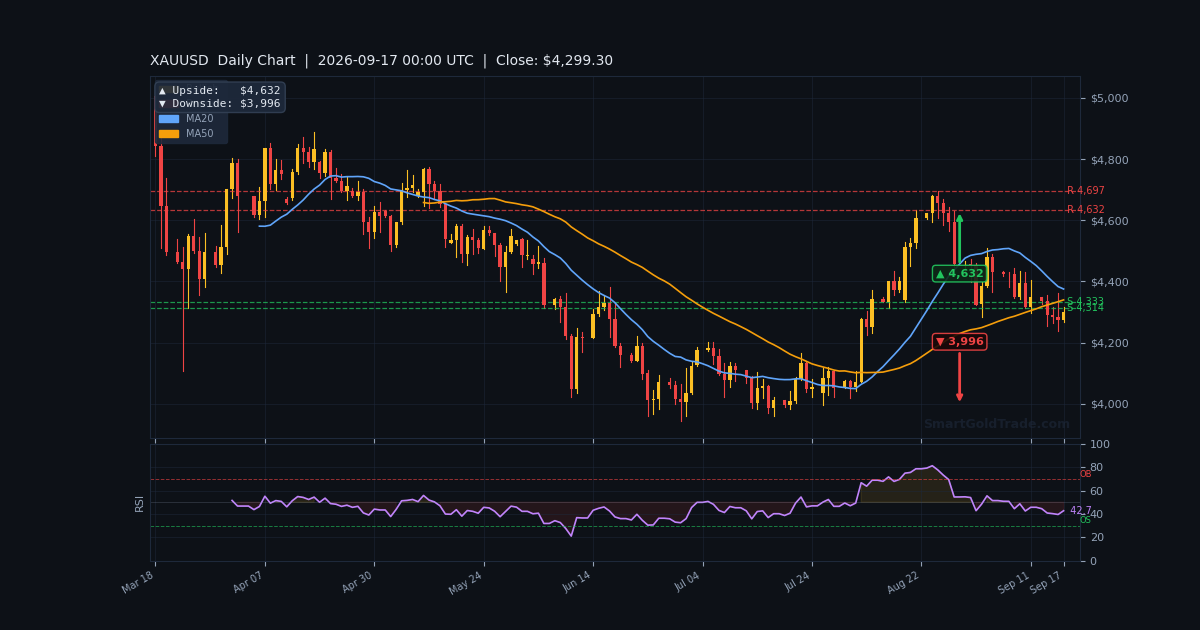
The gold price is holding near $4,300.42 in a thin Asian session, hours after the Federal Reserve delivered its first rate hike since July 2023. The metal is trading below its EMA200 at $4,353.58, which keeps the broader structure bearish. Wednesday's FOMC decision lifted the funds rate to 3.75%–4.0%, and Chair Kevin Warsh signalled more tightening could follow.
That hawkish tone pushed the dollar higher and pressured non-yielding bullion, though the pullback has been orderly rather than panicked. With liquidity thin and no major data due until US Initial Jobless Claims later today, this session is about positioning, not chasing. The levels below will define whether the next leg is a bounce or a breakdown.
Gold Market Overview
Macro Context
The dollar index sits at 100.35, up modestly on the day, and that strength is the single biggest headwind for the gold price right now. Higher Treasury yields compound the problem — gold pays no coupon, so rising real rates make it relatively less attractive to hold. Warsh told markets that inflation remains "too high and has been for too long," and money markets now price roughly a 49.8% chance of another hike in October.
President Trump publicly demanded rates be cut to 1% "or less," and separately said he told Warsh to vote with the board because the outcome was already decided. That friction between the White House and an independent Fed is a slow-burning safe-haven factor. Commerzbank analysts noted the pullback reflects a tug-of-war between geopolitical demand and macro headwinds, with higher yields and a firmer dollar capping upside.
Session Outlook
Asian liquidity is thin, and with the Fed decision already digested, expect a narrow, two-way range rather than a trending session. The most likely corridor is $4,292 to $4,318, bounded by S1 and R2. Watch for any headline on the BoE decision later today or fresh Trump commentary on the Fed — either could trigger a sharp but short-lived spike.
Do not chase moves in this environment. Low-volume breakouts in the Asian session routinely reverse once European desks arrive. Patience and pre-defined levels are the edge here.
Technical Analysis
Moving Average Structure
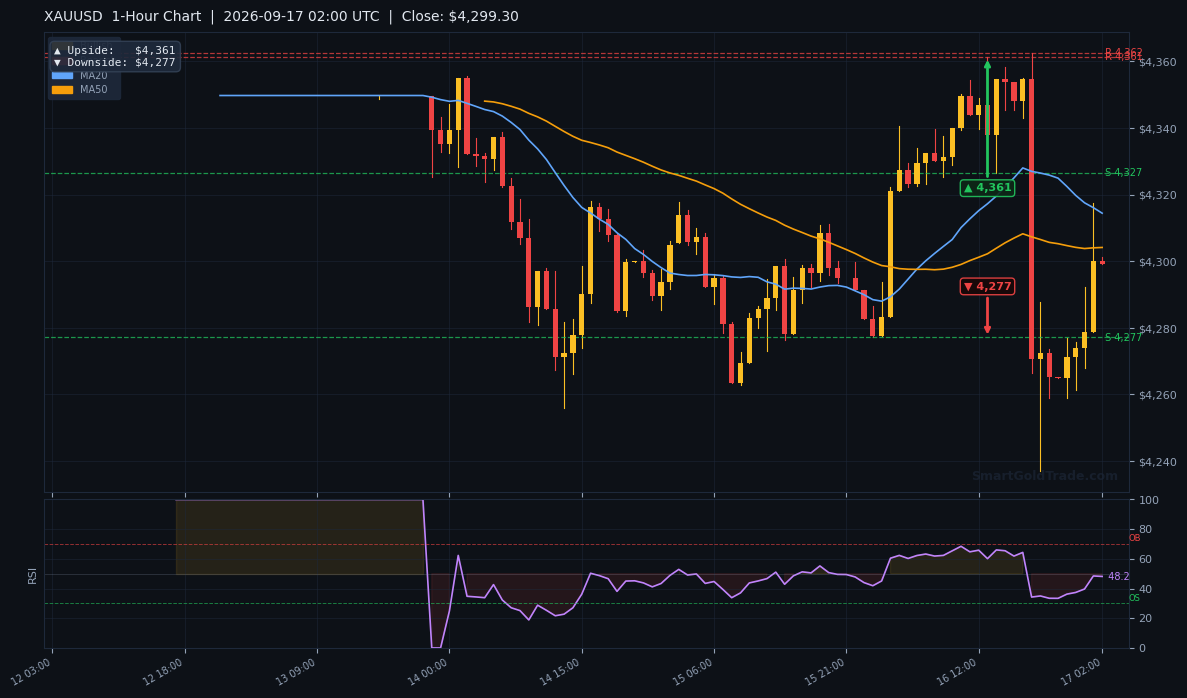
The gold price is trading below all three key moving averages, which confirms the bearish structure. The EMA20 sits at $4,304.17, the EMA50 at $4,309.59, and the EMA200 at $4,353.58. Price below the EMA200 on the H1 chart means rallies into the $4,304–$4,310 zone are likely to meet sellers first.
On higher timeframes the picture is consistent. The H4 EMA200 is at $4,361.97 and the D1 EMA200 at $4,319.07, both above spot. Until the gold price reclaims at least $4,319 on a daily close, the path of least resistance remains lower.
RSI and Momentum
The RSI(14) reads 48.3 — squarely neutral, with no oversold signal to tempt dip buyers. Stochastics at 37.1/30.1 lean weak but are not yet in capitulation territory. MACD at -8.45 with a histogram of -6.34 shows negative momentum that is steady rather than accelerating.
ADX at 27.7 confirms a genuine trend is in place, so this is not random chop. The takeaway: momentum favours the downside, but the absence of an oversold reading means there is room to fall further before a bounce becomes technically likely.
Key Price Levels
Immediate support is S1 at $4,292.11, with S2 at $4,282.63 and the VWAP at $4,284.95 reinforcing that zone. Resistance begins at R1 $4,304.31, then R2 $4,317.63. The ATR(14) of $25.05 implies an expected hourly range of roughly 0.58%, so a session move of $25–$40 is normal.
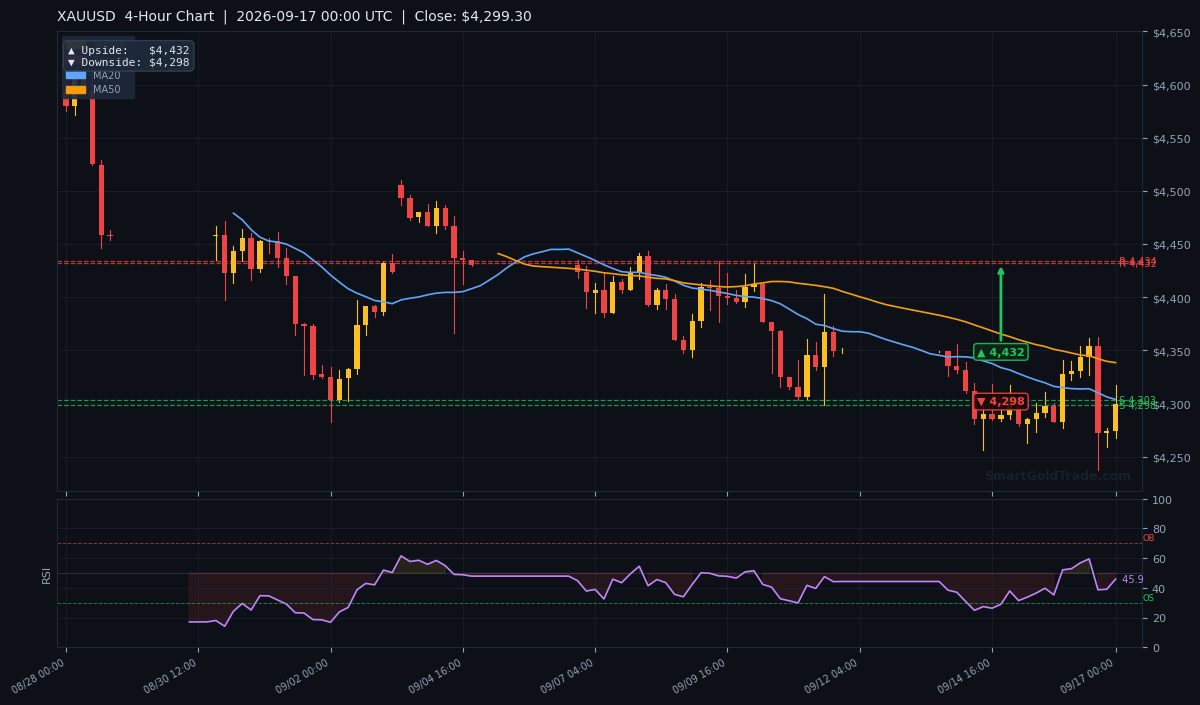
| Timeframe | Upside Target | Downside Target |
|---|---|---|
| Daily | $4,632 | $3,996 |
| 4-Hour | $4,432 | $4,298 |
| 1-Hour | $4,361 | $4,277 |
Fundamental Drivers
Wednesday's FOMC decision is the dominant force. The committee voted unanimously to raise rates to 3.75%–4.0%, the first hike since July 2023. Warsh framed it as a "sober" and "responsible" move, citing multiple product categories running above 3% annualised. Morgan Stanley's Michael Gapen called it hawkish, noting that if the chair sees policy as accommodative, "you've got more work to do."
That directly pressures the gold price through two channels: a firmer dollar and higher yields. Commerzbank also flagged robust Indian jewellery inflation, a reminder that physical demand remains a quiet floor. On the geopolitical side, the prolonged Middle East conflict and rising energy prices keep a safe-haven bid alive, which is why the decline has been measured rather than violent.
Key Event to Watch
The Bank of England decision later today is the next scheduled catalyst. A hawkish hold — as MUFG/BTMU expect — would reinforce the global tightening theme and add pressure to gold. The other wildcard is US Initial Jobless Claims. A soft print could revive rate-cut hopes and spark a short squeeze back toward $4,317.
If you trade around these releases, an automated pause during high-impact events can protect open positions from whipsaw. Tools like news event trading protection exist precisely for this kind of session.
Devil's Advocate
The bearish case rests on price staying below $4,304. If the gold price closes an H1 candle above R1 at $4,304.31 and holds, the immediate bias flips neutral and a run at $4,317.63 becomes likely. A break above R2 would invalidate the short setup entirely.
The bigger risk is a headline-driven reversal. Trump's public pressure on the Fed, or any escalation in the Middle East, could trigger safe-haven buying that ignores the technical structure. The reversal level to watch is $4,292.11 on the downside — losing it opens $4,282.63, while reclaiming $4,304 flips the script. Trade the reaction, not the prediction.
Trading Strategy for Asian Session
With the gold price at $4,300.42 and momentum neutral-to-weak, the cleaner setup is a short into resistance rather than a chase lower. Consider an entry zone between $4,304 and $4,310, where the EMA20 and EMA50 cluster. Place your stop above R2 at $4,318, roughly one ATR beyond entry, which keeps risk defined at about $25 per ounce.
First target is S1 at $4,292.11, with a second target at S2 $4,282.63. That gives a favourable risk-to-reward if price respects the moving average wall. If instead price breaks and closes above $4,318, stand aside — the setup is dead.
For those building longer-term exposure rather than trading the session, physical accumulation below $4,300 has historically been a patient strategy. You can buy certified gold coins and bars directly if your goal is ownership rather than leverage. Either way, size positions so a $25 adverse move is survivable.
Key Takeaways
- Gold price at $4,300.42, below the EMA200 at $4,353.58 — bearish structure intact.
- RSI 48.3 is neutral, so there is no oversold bounce signal yet.
- Support: S1 $4,292.11, S2 $4,282.63. Resistance: R1 $4,304.31, R2 $4,317.63.
- ATR of $25.05 implies a normal session range of roughly 0.58%.
- Fed hiked to 3.75%–4.0%; October hike odds near 49.8%.
- BoE decision and US Jobless Claims are today's key catalysts.
Conclusion
The gold price enters the Asian session on the back foot, capped by a hawkish Fed and a firmer dollar. Price below every major moving average keeps the bias tilted lower, with $4,292 the first line of defence and $4,277 the 1-hour downside target if that gives way. Bulls need a close above $4,304 to stall the decline.
Thin liquidity means discipline matters more than conviction today. Wait for levels to be tested, let the reaction confirm, and avoid chasing mid-range moves. The next 24 hours should clarify whether this is a pause before a deeper pullback or the early stages of a base.
Frequently Asked Questions
- Why is the gold price falling today?
- The Fed raised rates to 3.75%–4.0% and signalled more tightening, lifting the dollar and Treasury yields. Gold pays no yield, so it faces headwinds. Price sits at $4,300.42, below the EMA200 at $4,353.58.
- What are the key support levels for gold right now?
- Immediate support is S1 at $4,292.11, followed by S2 at $4,282.63 and the VWAP at $4,284.95. A clean break below $4,282 opens the 1-hour downside target of $4,277.
- Where is resistance for XAU/USD?
- R1 sits at $4,304.31 and R2 at $4,317.63. The EMA20 at $4,304.17 and EMA50 at $4,309.59 cluster in that zone, making it the first real test for bulls.
- Is now a good time to buy gold?
- That depends on your timeframe. Short-term momentum favours the downside while price is below $4,304. Longer-term buyers often accumulate on dips toward $4,292 or lower, but position sizing matters given the $25 ATR.
- What event could reverse the bearish bias?
- A hawkish surprise is already priced, so the risk is a dovish pivot. Weak US Jobless Claims data or softer BoE guidance could push the gold price back above $4,318 and invalidate the short setup.
Trading Gold (XAU/USD) carries significant risk of loss and is not suitable for all investors. This content is for informational purposes only and does not constitute financial advice. Always conduct your own research and trade responsibly.