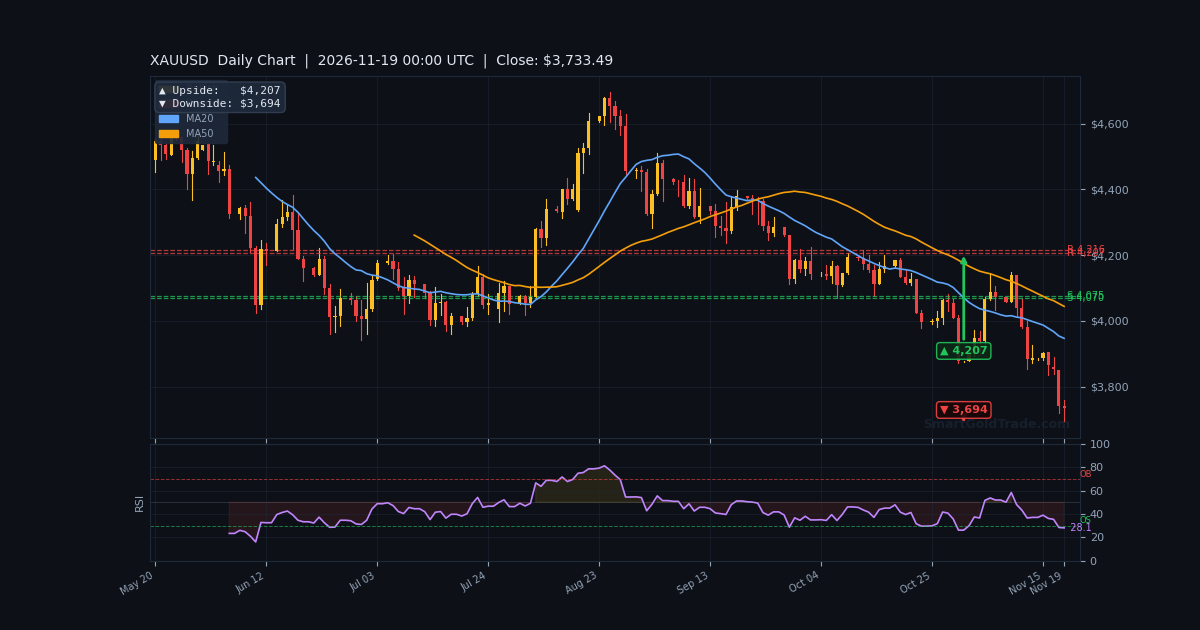
The gold price has collapsed to $3,740.47 during the European session, extending its slide to a fresh 14-month low as hawkish Federal Reserve rhetoric and a resurgent US dollar crush the precious metal. Wednesday's FOMC minutes revealed that nearly all policymakers see further rate hikes as justified, while Fed Governor Christopher Waller explicitly called for a 50-basis-point move in December. The yellow metal briefly bounced overnight but sellers returned with a vengeance after reports emerged that President Trump is weighing additional military strikes on Iran. With the dollar index hitting a 19-month high and real yields climbing, gold remains under heavy pressure. This session, traders must watch whether $3,693.53 holds as the last line of defense before a deeper capitulation.
Gold Market Overview
Macro Context
The macro backdrop for gold has turned decidedly hostile. The broad dollar index has surged to 122.7, its highest level in 19 months, as Fed policymakers signal a prolonged tightening cycle. The 10-year TIPS real yield has climbed to 2.89%, up 0.23% week-over-week, while the nominal 10-year yield sits at 5.10%. Rising real yields increase the opportunity cost of holding non-yielding assets like gold, and the correlation is playing out in real time.
Fed Governor Waller's FXS Speechtracker score of 9.2/10 — well above the 7.9 baseline — underscores the severity of his hawkish shift. He warned that inflation is "heading in the wrong direction and broadening" and suggested the Fed may need to "shock" markets out of complacency. Markets now price a nearly 90% probability of a 25-basis-point hike in December, with a 10% chance of a larger 50-basis-point move. Geopolitical risk from US-Iran tensions has provided only fleeting support.
Session Outlook
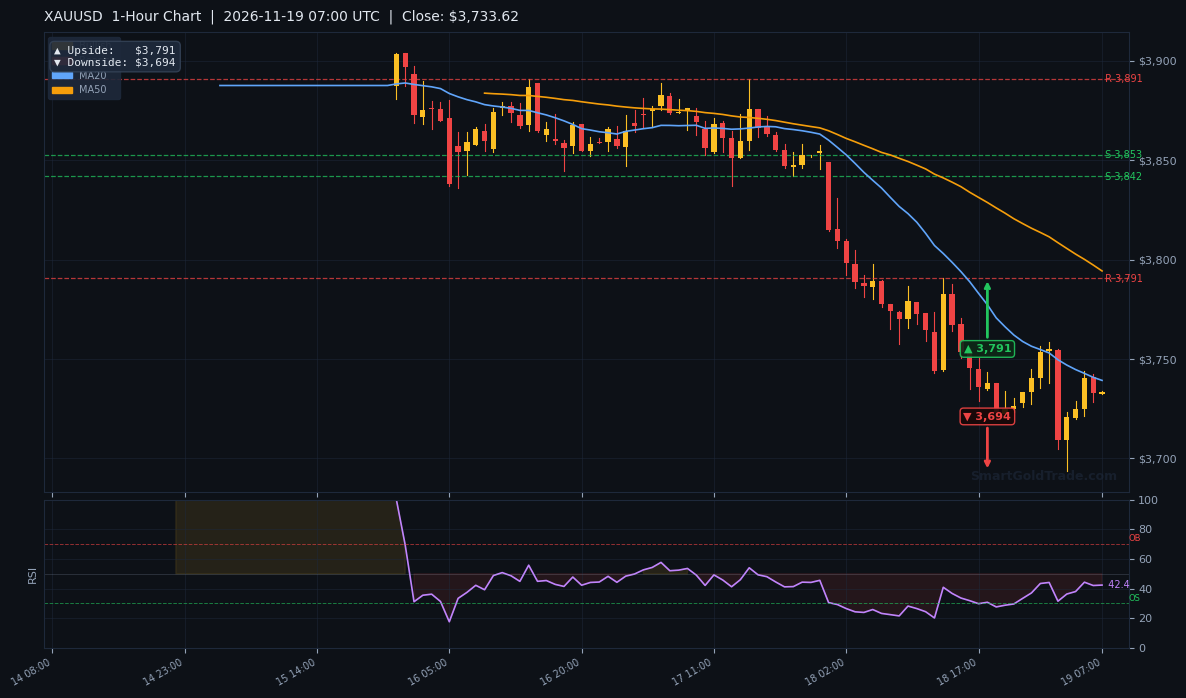
European session liquidity is picking up, and volatility is expanding. The ATR(14) of $20.47 suggests an expected hourly range of roughly 0.55% of price. With the ADX at 35.8 and -DI at 29.33 versus +DI at 19.18, the downtrend remains firmly intact. Traders should watch for a test of $3,719.89 (prior day low) and the critical $3,693.53 support. A break below opens the door to $3,693.53, the downside pivot target. Resistance is layered at $3,748.39 (EMA20) and $3,790.54 (R1).
Technical Analysis
Moving Average Structure
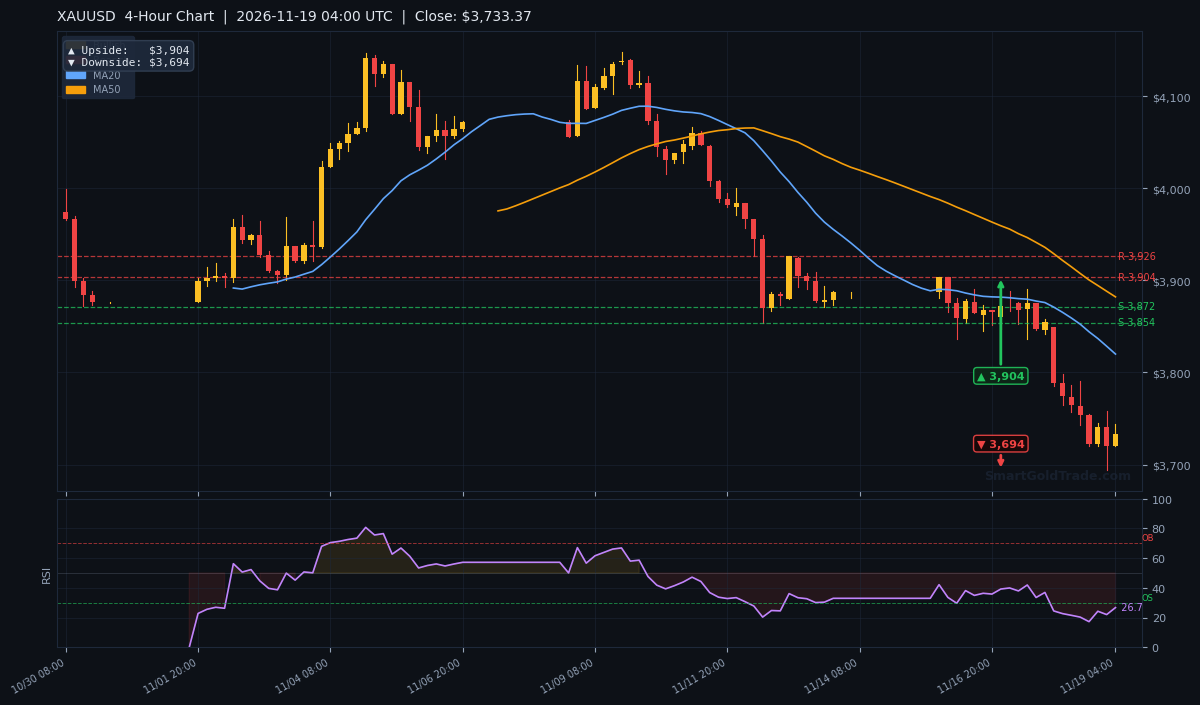
The moving average configuration confirms a dominant bearish trend. The EMA20 sits at $3,748.39, the EMA50 at $3,788.59, and the EMA200 at $3,899.21. Price at $3,740.47 trades below all three, with the EMA20 below the EMA50 — a classic bearish alignment. On the H4 timeframe, the close of $3,740.64 is well below the EMA50 at $3,890.43 and EMA200 at $4,035.83. The daily close of $3,740.59 similarly sits below the D1 EMA50 at $4,073.45. This structure favors continued downside.
RSI and Momentum
The RSI(14) on the H1 chart reads 43.9, placing it in neutral territory but with a clear downward bias. The H4 RSI at 28.3 is approaching oversold conditions, while the D1 RSI at 31.3 is also near oversold. The MACD histogram is positive at +2.64, with the MACD line at -20.16 above the signal line at -22.80 — a potential early sign of fading downside momentum on the hourly. However, the Stochastic readings of 40.7/30.1 suggest no immediate reversal signal.
Key Price Levels
Support is defined at S1 $3,693.53 and S2 $3,693.53 (the downside pivot target). Resistance stands at R1 $3,790.54 and R2 $3,886.69. The Bollinger Bands show the lower band at $3,704.32, the middle at $3,744.88, and the upper at $3,785.44. Price is trading below the middle band, confirming bearish control. The VWAP at $3,732.63 is slightly below current price, indicating a modest intraday premium.
Fundamental Drivers
The dominant fundamental driver remains the Federal Reserve's hawkish pivot. Wednesday's FOMC minutes showed that nearly all members agreed further rate hikes would be necessary "in the months ahead" to return inflation to 2%. Two policymakers even suggested a hike of "more than 25 basis points" could be warranted in December if inflation data disappoints. This follows October's CPI report, which showed inflation broadening across goods and services.
Fed Governor Waller's explicit call for a 50-basis-point hike in December or a signal of faster hikes in 2027 has intensified selling pressure. The FXS Fed Sentiment Index rose 1.77 points to 149.86, firmly in hawkish territory. Meanwhile, SPDR GLD holdings increased by 2.6 tonnes to 1,048.7 tonnes — a modest inflow that has failed to stem the price decline. COT data shows speculators net long at 190,107 contracts, a positioning that could fuel further liquidation if support breaks.
Key Event to Watch
The weekly US Initial Jobless Claims report, due later today, is the primary event risk. A stronger-than-expected print would reinforce the hawkish narrative and likely accelerate gold's decline toward $3,693.53. Conversely, a weak reading could provide temporary relief, but the broader trend remains lower.
Unified Technical & Fundamental Outlook
The technical pillar is clearly bearish, scoring -0.75, with price below all key moving averages and a confirmed H1 downtrend. The fundamental pillar is also bearish at -0.33, driven by rising real yields, a strengthening dollar, and hawkish Fed rhetoric. The combined assessment is bearish at -0.54, with both pillars aligned — a rare and powerful confluence.
The strongest confluence is the dollar-yield dynamic. The dollar index at 122.7 and 10-year real yield at 2.89% are both rising, creating a dual headwind for gold. The only supportive factor — GLD inflows — is insufficient to offset the macro pressure. This alignment suggests the path of least resistance remains lower.
Devil's Advocate
What could invalidate the bearish bias? The H4 RSI at 28.3 is approaching oversold territory, and the H1 MACD histogram is positive, suggesting momentum could be fading. A daily close above $3,790.54 (R1) would signal a short-term reversal and force bears to reconsider. Additionally, the geopolitical risk from US-Iran tensions could escalate unexpectedly, triggering safe-haven demand. The key reversal level to watch is $3,693.53 — a breakdown below could trigger a capitulation, while a bounce from this level could set up a relief rally toward $3,748.39.
Trading Strategy for European Session
Given the aligned bearish bias, the strategy favors selling rallies. An entry zone between $3,748.39 and $3,748.39 (near the EMA20 and VWAP) offers a favorable risk-reward. Place a stop loss at $3,790.54 (above R1 and EMA50), risking approximately $35-42 per ounce. Take profit targets are $3,719.89 (prior day low) and $3,693.53 (S1).
For aggressive traders, a break below $3,719.89 with volume could justify a momentum short targeting $3,693.53. Alternatively, a bounce from $3,693.53 with bullish divergence could offer a counter-trend long targeting $3,748.39. Position sizing should account for the elevated ATR of $20.47. For those seeking professional guidance, real-time trading alerts can help navigate these volatile conditions.
Key Takeaways
- Gold price at $3,740.47, down 3.26% this week and at a 14-month low.
- Critical support at $3,693.53; a break opens $3,693.53 downside target.
- Resistance at $3,790.54 (R1) caps any rebound.
- EMA200 at $3,899.21 confirms bearish structure; price below all key MAs.
- Fed hawkishness and dollar at 19-month high drive the selloff.
- ATR of $20.47 suggests elevated volatility; manage risk tightly.
Conclusion
The gold price remains under severe pressure as the Fed's hawkish stance and a surging dollar create a perfect storm for bears. With both technical and fundamental pillars aligned bearish, the path of least resistance points lower. The $3,693.53 level is the line in the sand — a break below could trigger a cascade of stop-loss selling, while a hold could produce a short-term bounce. Traders should monitor the US Initial Jobless Claims report and any geopolitical developments for catalysts. The trend remains your friend until $3,790.54 is reclaimed.
Frequently Asked Questions
- Why is the gold price falling today?
- The gold price is falling due to hawkish Fed minutes, Governor Waller's call for a 50bps hike, and a dollar index at a 19-month high. Rising real yields at 2.89% increase the opportunity cost of holding gold.
- What is the next key support level for gold?
- The immediate support is $3,693.53 (S1), followed by the downside pivot target of $3,693.53.
- Can gold price bounce from here?
- A bounce is possible if $3,693.53 holds and the H4 RSI (28.3) triggers oversold buying. The first resistance is $3,748.39 (EMA20), then $3,790.54 (R1).
- What is the trading strategy for gold today?
- Sell rallies between $3,748.39 and $3,748.39 with a stop at $3,790.54, targeting $3,719.89 and $3,693.53. Alternatively, buy a confirmed bounce from $3,693.53 targeting $3,748.39.
Trading Gold (XAU/USD) carries significant risk of loss and is not suitable for all investors. This content is for informational purposes only and does not constitute financial advice. Always conduct your own research and trade responsibly.