Gold price is under pressure as the European session gets underway, with XAUUSD hovering just above the $4,120 handle after a failed attempt to reclaim $4,165 resistance. Last week’s disappointing US Non-Farm Payrolls report sent gold above $4,150, but bulls have struggled to sustain momentum, leaving the precious metal vulnerable to a deeper retracement. With London desks opening and volatility picking up, the $4,165 level has shifted from support to resistance, and a break below $4,148 could accelerate selling pressure. Traders are now watching whether the short-term bearish momentum can push gold toward the $4,136 zone or if buyers step in to defend the mid-term uptrend. This session’s price action will likely set the tone for the remainder of the week, making the next few hours critical for position sizing and risk management.
Gold Market Overview
Macro Context
The US Dollar Index (DXY) is trading around 97.50, up 0.2% this morning, which typically weighs on gold price. US 10-year Treasury yields have edged higher to 3.85%, reducing the appeal of non-yielding assets like gold. Fed funds futures now price a 72% chance of a rate cut in September, but hawkish comments from Fed officials earlier this week have kept the dollar supported.
Geopolitically, simmering tensions in the Middle East continue to provide a safe-haven bid, but the immediate focus remains on central bank policy divergence. The mix of a firm dollar and rising yields challenges gold, even as the longer-term rate-cut narrative persists.
Session Outlook
The European session brings increased liquidity as London opens, with the $4,120–$4,165 corridor expected to contain most intraday swings. Thin liquidity above $4,165 means stops could amplify a breakout, but heavy resistance at the 20-period moving average near $4,152 suggests rallies will likely be sold.
The ATR of $15.56 indicates a daily range of roughly $30, so a break of the $4,148 S2 could quickly expose $4,136. Conversely, a close above $4,165 would invalidate the immediate bearish bias and target $4,184. With no major US economic data on tap today, price action will be driven by flows and technical levels.
Technical Analysis
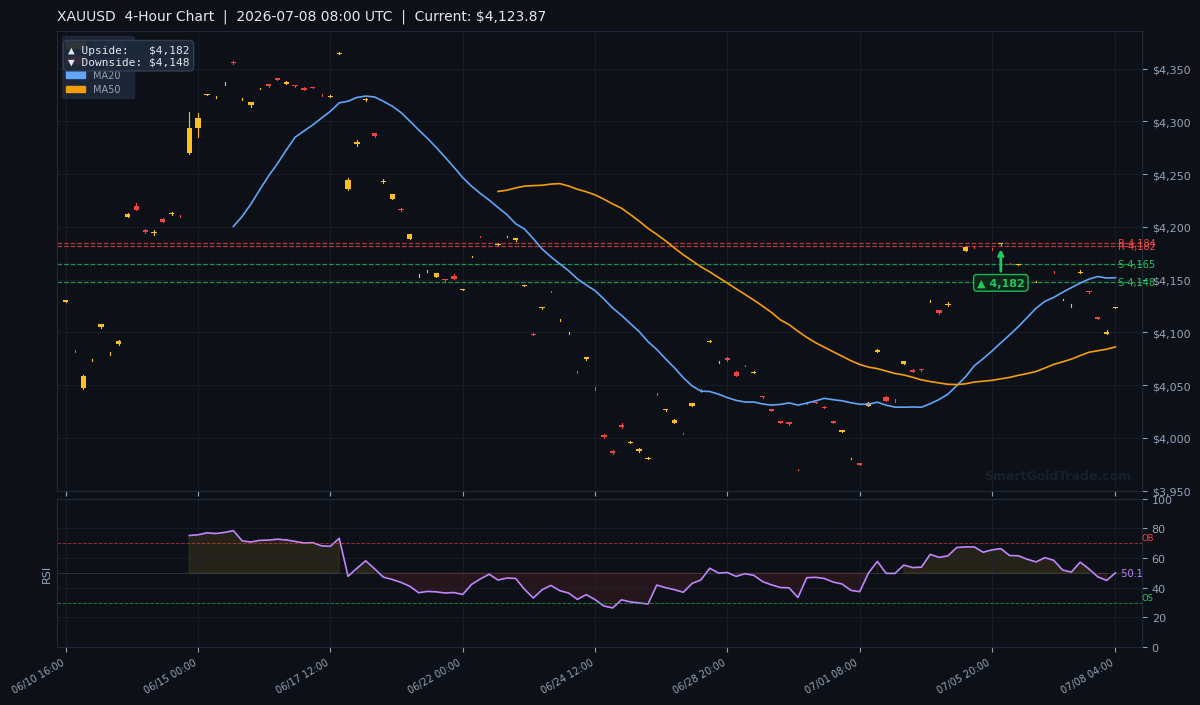
The technical picture for gold price on July 8, 2026 is decidedly mixed, with conflicting signals across timeframes. On the four-hour chart, the current price of $4,123.87 sits below the 20-period simple moving average (MA20) at $4,151.75, signalling short-term bearish momentum. However, price remains above the 50-period (MA50) at $4,086.20, keeping the mid-term uptrend alive. The 200-period (MA200) at $4,265.22 is far above, placing gold in bearish territory from a long-term perspective.
Moving Average Structure
The EMA alignment shows the MA20 has crossed above the MA50, creating a short-term bullish momentum structure. Yet, with price trading below the MA20, this suggests a deep pullback within an uptrend — a classic setup that often sees a retest of support before the next leg higher. As long as gold holds above $4,086.20, the larger bull trend remains intact, but a break below could flip the narrative.
RSI and Momentum
The 14-period RSI reads 50.0, exactly at the neutral midpoint. This indicates balanced momentum — neither overbought nor oversold — and leaves room for a sharp move in either direction. In pullback scenarios, an RSI that holds above 40 often sees buyers step in. Conversely, a drop below 45 would confirm downside acceleration.
Key Price Levels
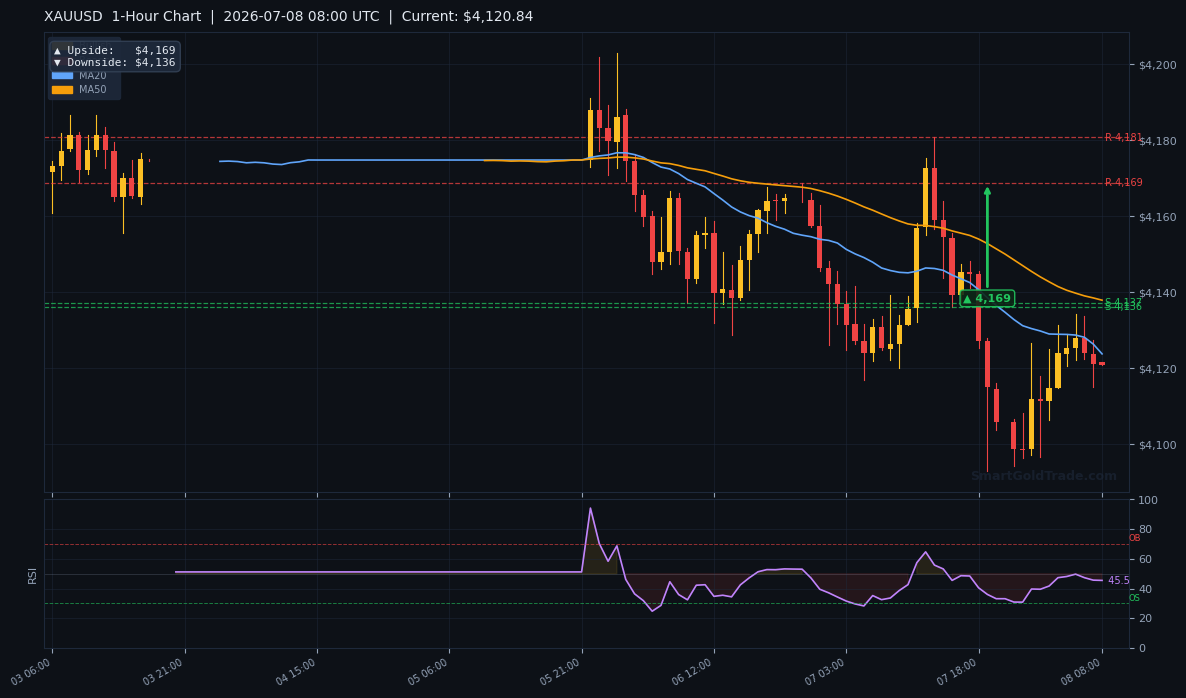
Using the pivot-based support and resistance framework, immediate resistance sits at $4,184.32 (R1), with R2 at $4,181.55 (a minor level just below). On the downside, $4,164.51 (S1) is the first line of defence, now acting as resistance after being broken overnight. The next critical floor is $4,147.61 (S2), which aligns closely with the 4-hour downside target of $4,148. The average true range (ATR) of $15.56 suggests the expected intraday range extends from about $4,110 to $4,150. A break below S2 would open a path to the 1-hour target at $4,136.
| Timeframe | Upside Target | Downside Target |
|---|---|---|
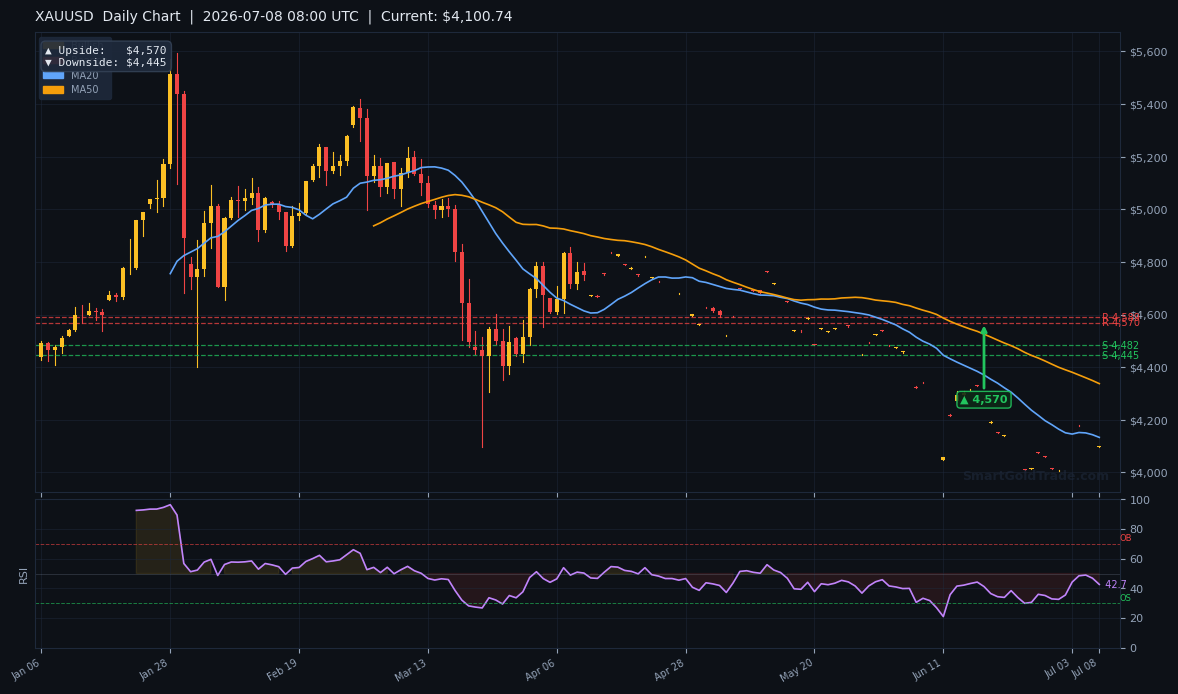
| Daily | $4,570 | $4,445 |
| 4-Hour | $4,182 | $4,148 |
| 1-Hour | $4,169 | $4,136 |
Fundamental Drivers
Central Bank Divergence and the RBNZ Factor
This week, traders are laser-focused on the Reserve Bank of New Zealand’s July policy meeting. Commerzbank analyst Volkmar Baur expects the RBNZ to deliver a rate hike to cement its inflation-fighting credibility, a move that would initially boost the New Zealand Dollar. A stronger NZD tends to weaken the US Dollar basket, which often provides a tailwind for gold. However, if the RBNZ decision sends a hawkish shockwave that lifts global bond yields, gold could come under pressure as a non-yielding asset.
In the US, the spotlight remains on the Federal Reserve’s next move. With the June Fed meeting minutes showing a cautious consensus, markets are pricing in a September rate cut, but any hint of hawkish rhetoric from this week’s Fed speakers could reverse the trade. The DXY’s modest gain this morning suggests that the dollar is not yet ready to roll over, keeping gold price capped.
Key Event to Watch
The single most important event this week is the RBNZ rate decision. A 25-basis-point hike could initially push gold higher via a softer USD, but if the statement is overly aggressive and triggers a risk-off move, gold might first dip toward $4,148 before recovering. Traders should monitor the immediate reaction in the NZD/USD pair; a sharp rally above 0.6200 could drag DXY lower and lift gold above $4,165.
Devil's Advocate
While the immediate bias favours further downside, the bull case has not been fully negated. If gold price can reclaim and hold above the MA20 at $4,151.75, the short-term bearish structure would dissolve, opening a rally toward $4,184.32. A daily close above $4,165 would be the first signal that buyers are defending the uptrend. The RSI at 50 gives no edge to either side, so a sharp reversal could catch bears offside. The most probable invalidation level is a sustained break above $4,184.32, which would shift control back to bulls and target the daily upside at $4,570. Until that happens, selling into strength remains the higher-probability play.
Trading Strategy for European Session
Given the current price action below the MA20 and rejection at $4,165, a short bias is warranted, but waiting for a retest of resistance offers a better risk-reward. Entry zone: sell between $4,160 and $4,165, where the former support-turned-resistance and S1 converge. Place a stop loss at $4,184, just above R1 and the recent swing high, giving a buffer equal to roughly 1.2 times the ATR of $15.56.
The first take-profit target is $4,148 (S2 / 4-hour target), and the second is $4,136 (1-hour downside target). For a partial runner, a trailing stop after the first target could capture an extended drop toward $4,110. Alternative scenario: If gold price breaks above $4,165 and holds for 30 minutes, consider a long entry targeting $4,184 with a stop below $4,148. For traders seeking precise, real-time entry signals, professional gold trading signals can complement your technical plan. Those following Islamic principles can execute this strategy without leverage via halal gold trading on SmartGoldTrade.
Key Takeaways
- Gold price is testing the critical $4,165 resistance-turned-support level, with a break below $4,148 risking a drop to $4,136.
- Short-term momentum remains bearish as $4,123.87 trades beneath the MA20 at $4,151.75.
- RSI at 50 keeps the range open for a spike in either direction; a move below 45 would confirm downside strength.
- The RBNZ rate decision this week could inject volatility — a hawkish surprise may boost gold via a weaker USD.
- The primary short setup targets $4,148 and $4,136, with a stop above $4,184.
- A daily close above $4,165 would shift the bias to bullish and target $4,184 and $4,570.
Conclusion
As the European session heats up, gold price finds itself at a make-or-break inflection point. The failure to hold above $4,165 and the persistent downtick below the MA20 keep sellers in control, with $4,148 the gatekeeper for a deeper slide. Yet, the mid-term trend remains bullish as long as $4,086 holds, so this pullback may be a temporary correction rather than a trend reversal. The RBNZ event and subsequent dollar moves will likely determine whether gold tests the 1-hour target of $4,136 or stages a recovery back to $4,184. In either case, volatility is rising, and discipline around price levels is essential. Monitor the H4 close relative to $4,165 — that will signal the next leg.
Frequently Asked Questions
- What is the key support level for gold price today?
- The most important near-term support is $4,164.51 (S1), which has now flipped to resistance. Below that, $4,147.61 (S2) is the make-or-break floor; a break below would target the 1-hour downside level of $4,136.
- Where should I set my stop loss for a gold short trade?
- Based on the ATR of $15.56, a stop loss at $4,184 provides enough room above the MA20 and R1 resistance, avoiding a premature exit. This stop is roughly 1.2 ATR above the entry zone of $4,160–$4,165.
- Is the gold trend bullish or bearish today?
- Short-term trend is bearish because gold price trades below the MA20 at $4,151.75. However, the mid-term trend remains bullish as price is above the MA50 at $4,086.20, so this is a corrective move within a larger uptrend.
- What event could change gold’s direction this week?
- The Reserve Bank of New Zealand’s rate decision is the standout event. A hawkish hike could weaken the US Dollar and lift gold above $4,165, while a more cautious tone might keep a lid on prices and support a retest of $4,148.
Risk Disclaimer: Trading Gold (XAU/USD) carries significant risk of loss and is not suitable for all investors. This content is for informational purposes only and does not constitute financial advice. Always conduct your own research and trade responsibly.