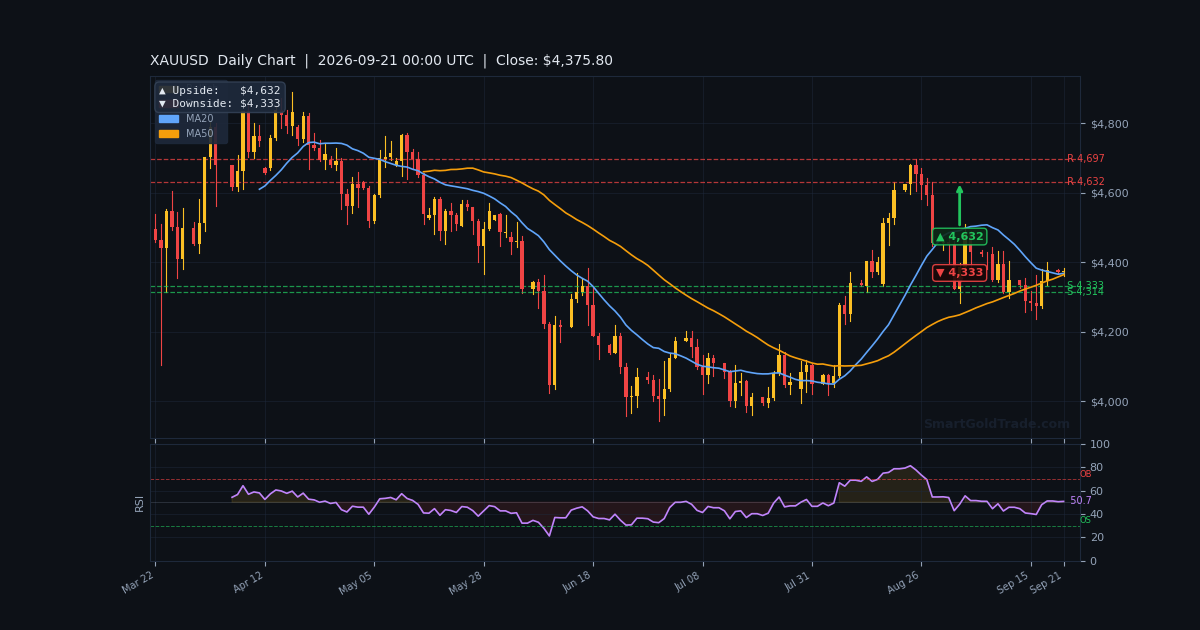
The gold price is holding a delicate line at $4,377.44 during Monday's Asian session, caught between a hawkish Fed and escalating Middle East tensions. Last week's Federal Reserve meeting delivered a 25-basis-point hike and signaled more to come, while Iran's latest threats against US bases kept safe-haven demand intact. With liquidity thin and the market digesting these competing forces, today's session is about patience and preparation, not chasing. The setup at this exact level will likely define the next directional move.
Gold Market Overview
Macro Context
The US Dollar remains supported by the Fed's hawkish stance. Markets now price a 56.5% chance of another hike in October, up from 42.5% a week ago. This strength in the DXY is a direct headwind for the gold price.
Geopolitical risk, however, is providing a floor. Iran's military issued fresh retaliation threats over the weekend, and President Trump warned of potential new strikes. This two-way pull is keeping gold range-bound for now.
Treasury yields remain elevated, but the market is showing signs of exhaustion from the recent sell-off. The bears are starting to look tired, as noted by FXStreet, which suggests a potential low is forming.
Session Outlook
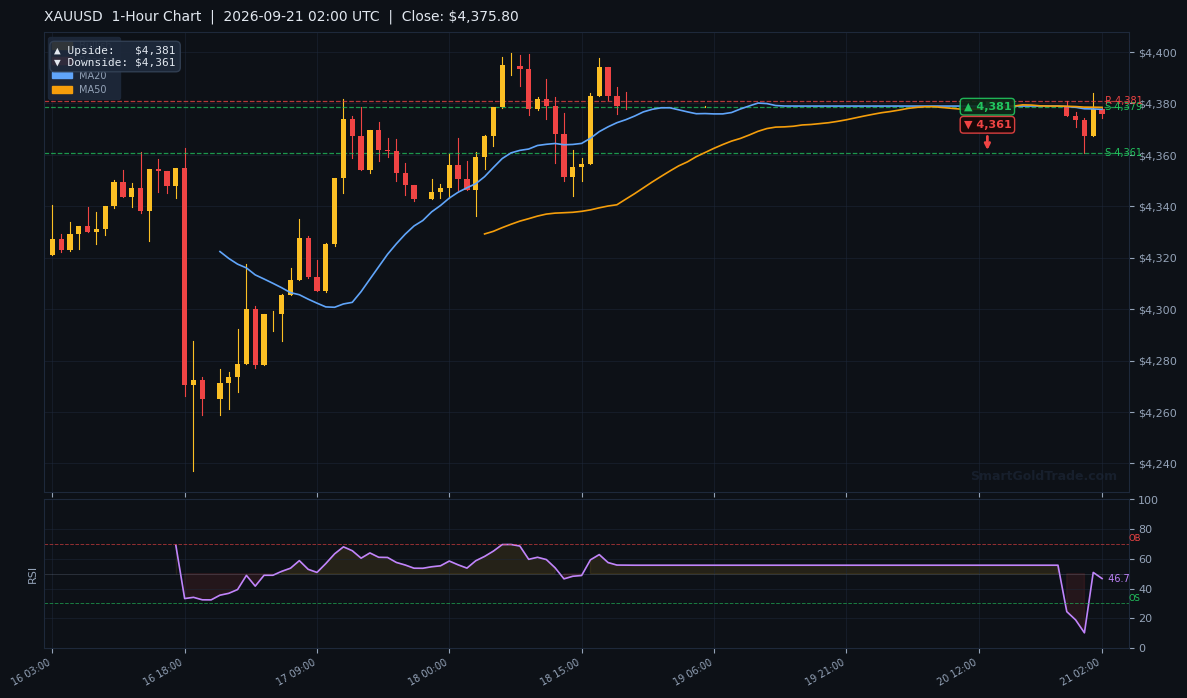
The Asian session is typically characterized by lower liquidity, and today is no exception. The ADX reading of 21.3 confirms a weak, ranging environment. Traders should expect choppy, range-bound price action between $4,375 and $4,381.
Do not chase breakouts in this thin volume. The real triggers will come later in the London and New York sessions. For now, focus on identifying the key levels that will act as launchpads or traps.
Technical Analysis
Moving Average Structure
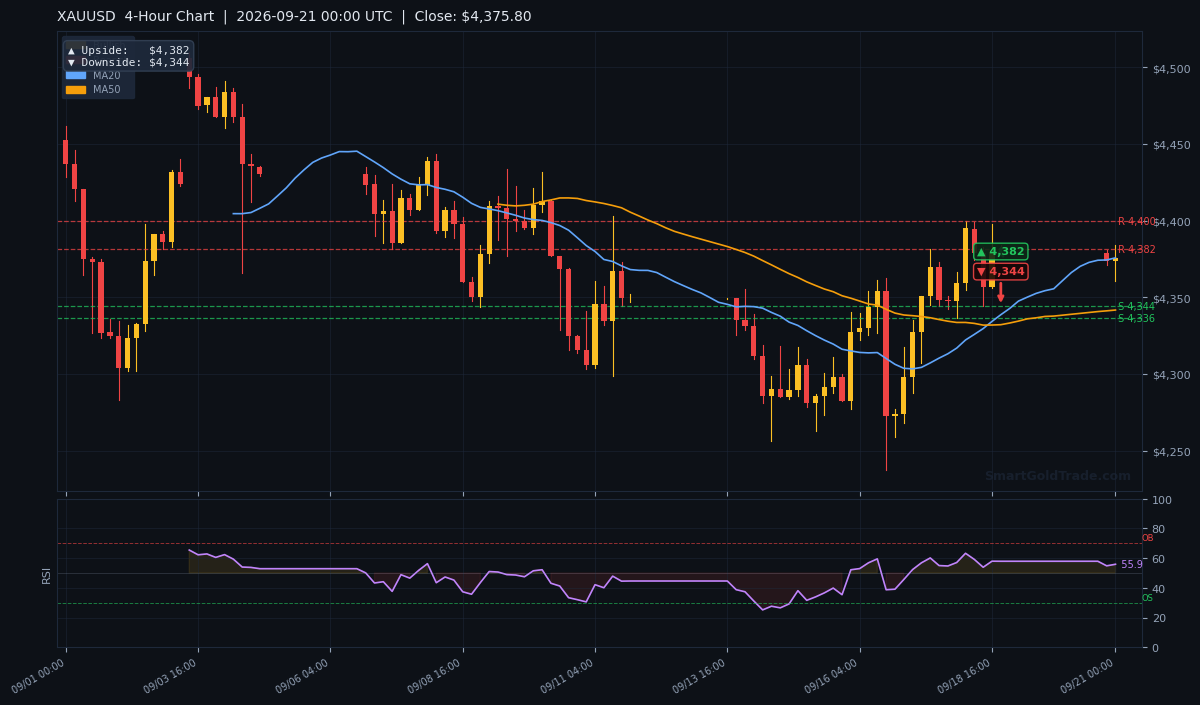
The moving averages paint a clear picture of a bullish structure that is being tested. The EMA20 sits at $4,371.12, just below the current price. The EMA50 and EMA200 are clustered at $4,355.97 and $4,355.15 respectively.
Price being above the EMA200 confirms the longer-term uptrend is still intact. However, the tight cluster of the EMAs below suggests that a break of $4,371 could trigger a quick slide toward the $4,356 area.
RSI and Momentum
Momentum is neutral. The RSI(14) is at 54.6, which is neither overbought nor oversold. This gives the market room to move in either direction without immediate exhaustion.
The Stochastic oscillators are also neutral at 54.2/54.4. The MACD is positive at 5.72, but the histogram is negative at -1.83, indicating fading bullish momentum. This suggests the current consolidation may continue before a clear direction emerges.
Key Price Levels
The immediate battle is at the pivot points. Support is defined at S1 $4,377.36 and S2 $4,375.16. Resistance is capped at R1 $4,381.07 and R2 $4,397.05.
The ATR(14) is $16.06, suggesting an expected hourly range of about 0.37%. The Bollinger Bands are wide, with the upper band at $4,401.30 and the lower at $4,351.61. The VWAP is at $4,373.13, just below price, acting as intraday support.
Fundamental Drivers
The dominant driver is the Fed's hawkish policy. Last week's rate hike and the signal for more tightening is the primary reason gold is struggling to break higher. The market is pricing in a 56.5% chance of an October hike.
This is being offset by safe-haven flows. The escalating conflict between the US and Iran is a major risk factor. Any further escalation could trigger a sharp rally in the gold price as investors seek safety.
Key Event to Watch
The single most important event this week is ECB President Christine Lagarde's speech later today. While not directly related to the US, any comments on inflation or rate policy could cause volatility in the DXY, which will directly impact gold. Traders should also monitor any headlines regarding the Middle East conflict.
Devil's Advocate
The main bullish thesis could be invalidated by a hawkish surprise from the Fed or a de-escalation in the Middle East. A sustained break below S2 $4,375.16 would be the first warning sign.
If price then breaks below the EMA20 at $4,371.12, the next target would be the EMA50/200 cluster at $4,356. A break of that level would flip the trend to bearish. The key reversal level to watch is $4,375.
Trading Strategy for Asian Session
Given the low liquidity, the best strategy is to wait for the market to come to you. Do not chase the initial moves.
For a long trade, consider an entry zone near S1 $4,377.36 or the VWAP at $4,373.13. A stop loss should be placed below S2 $4,375.16, using a buffer of half the ATR, around $4,367. The first take-profit target is R1 $4,381.07, with a secondary target at R2 $4,397.05.
For a short trade, consider an entry near R1 $4,381.07. A stop loss should be placed above R2 $4,397.05, at approximately $4,390. The first target would be S1 $4,377.36, with a secondary target at S2 $4,375.16.
Key Takeaways
- The gold price is trading at $4,377.44, holding above the key EMA200 at $4,355.15.
- Momentum is neutral with RSI at 54.6 and ADX at 21.3, indicating a ranging market.
- Immediate support is at $4,377.36 (S1) and resistance is at $4,381.07 (R1).
- The Fed's hawkish stance is a headwind, while Middle East tensions provide a safe-haven bid.
- A break below $4,375 could accelerate a sell-off toward $4,356.
- The expected session range is approximately $16 based on the ATR.
Conclusion
The gold price is at a critical juncture, coiling at $4,377 in a low-volume session. The bullish structure above the EMA200 remains intact, but momentum is lacking. The market is waiting for a catalyst to break the current range.
For now, patience is key. Wait for a clear break and close above $4,381 to confirm bullish intent, or a break below $4,375 to signal a bearish shift. The battle for this level will likely set the tone for the rest of the week.
Frequently Asked Questions
- What is the current gold price?
- The current gold price is $4,377.44 as of the Asian session on September 21, 2026.
- What are the key support levels for gold?
- The immediate support levels are S1 at $4,377.36 and S2 at $4,375.16. A break below these could lead to a test of the EMA20 at $4,371.12.
- What is the resistance for gold today?
- The first resistance is R1 at $4,381.07, followed by R2 at $4,397.05.
- Is it a good time to buy gold?
- With the market in a ranging phase, it is best to wait for a clear break of either $4,381 or $4,375. Chasing the price in low liquidity is risky.
Risk Disclaimer: Trading Gold (XAU/USD) carries significant risk of loss and is not suitable for all investors. This content is for informational purposes only and does not constitute financial advice. Always conduct your own research and trade responsibly.