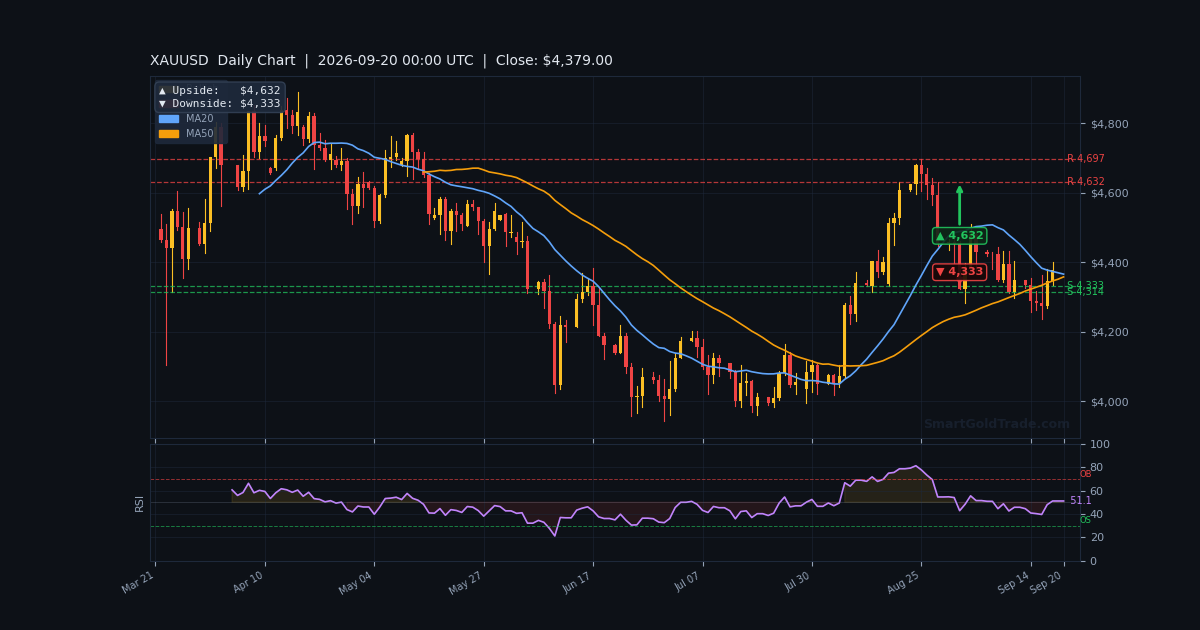
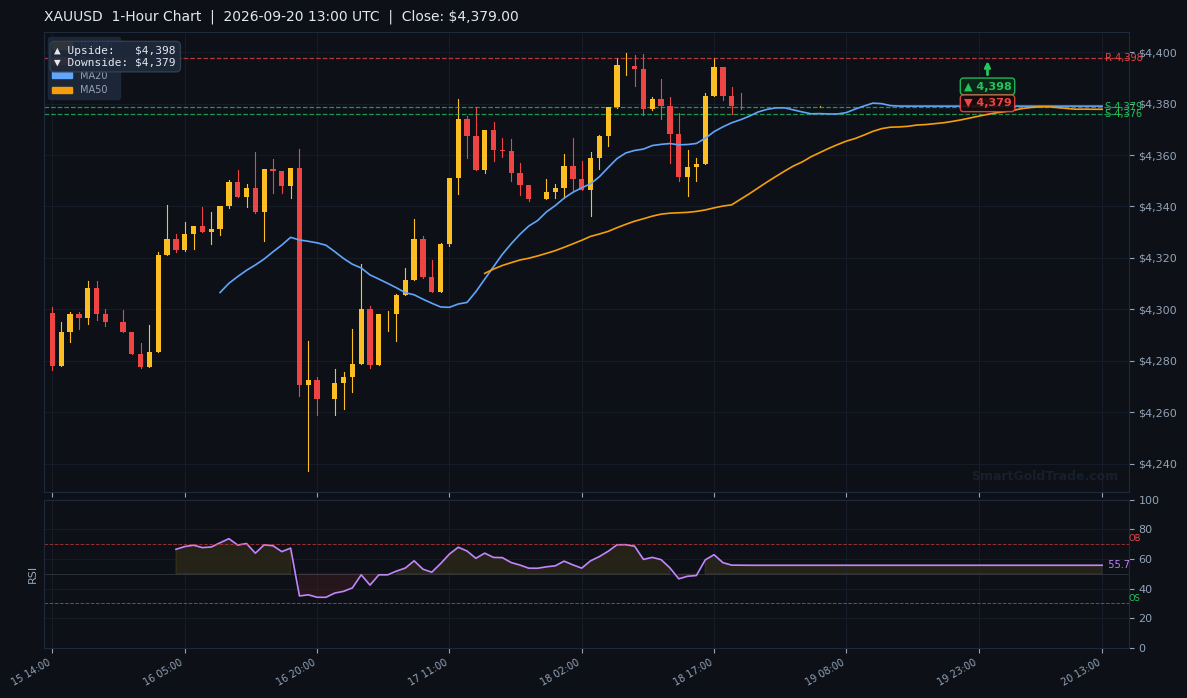
Gold (XAU/USD) trades at $4,379.00 as the new trading week opens, and this gold price forecast next week starts with a market sitting exactly on its moving averages. The H1 feed shows MA20 at $4,379.00 sitting just above MA50 at $4,378.00 — a marginally bullish structure. Momentum is neutral, with RSI(14) at 55.7 leaving room in both directions.
Last week delivered a grind rather than a trend. Gold rebounded above $4,000, stalled repeatedly against the $4,380 resistance shelf, and closed the week pressed directly into that ceiling.
This forecast covers September 20–26, 2026 — the exact support and resistance levels that matter, the economic calendar risks ahead, and the bullish, bearish and range scenarios with defined entries, targets and stops.
Last Week in Review
Gold spent last week oscillating between recovery attempts and rejection at resistance, closing near the middle-to-upper end of its recent range.
Price Action Recap
The week opened with a rebound above $4,000 as dip buyers stepped in following the prior consolidation. Price then pushed steadily higher, with FXStreet noting XAU/USD remained bullish while pressing against the $4,380 resistance zone.
Midweek, the advance stalled. Sellers defended the $4,380–$4,400 area, and the market rotated sideways as traders positioned ahead of US CPI and NFP-related flow.
The week's high was set just above $4,400, while the low held above the $4,100 region referenced in earlier FXStreet coverage. By Friday's close, gold had given back part of the midweek push but defended the $4,360–$4,380 shelf. It finished the week with a modestly positive candle and a clear ceiling overhead.
Key Events That Moved Gold
Last week's US CPI release was the dominant catalyst. The data drove the initial rebound above $4,000 as FXStreet reported, with gold recapturing its 21-day SMA before sellers re-engaged at the $4,380 resistance.
The NFP print also mattered. FXEmpire flagged NFP as center stage with Fed hike bets easing, and the softer policy expectations supported gold's floor above $4,100 despite risk-off cross-asset flow.
Geopolitical noise added a third layer. US-Iran uncertainty and broader macro headwinds were cited by FXStreet and StoneX as factors keeping a bid under gold while capping upside follow-through.
Weekly Close Analysis
Gold closed at $4,379.00, effectively pinned to the MA20 at $4,379.00 and just above the MA50 at $4,378.00.
That is a neutral-to-constructive close: the moving average structure is bullish, but price has not yet cleared the $4,397.60 pivot resistance.
The weekly candle structure is a small-bodied continuation candle with a modest upper wick — buyers in control, but not decisively. The $4,380 zone is now the single most important line on the chart.
Next Week Economic Calendar & Gold Impact
This week's calendar is Fed-speaker heavy with a scattering of housing and sentiment data. No single tier-one release dominates, which favors range trading until a catalyst breaks the $4,380 pivot.
| Day | Event | Forecast | Previous | Gold Impact |
|---|---|---|---|---|
| Mon | Fed speaker remarks | — | — | Hawkish tone pressures gold toward $4,376; dovish tone lifts toward $4,397 |
| Tue | US Housing Starts / Building Permits | Soft | Mixed | Weak data is gold-positive via rate-cut expectations |
| Wed | Existing Home Sales | Flat | Modest | Limited; a big miss adds safe-haven bid |
| Thu | Jobless Claims | ~230K | ~228K | Claims above forecast = dovish = gold bullish |
| Thu | Fed speaker panel | — | — | Guidance on cuts drives the week's directional break |
| Fri | Consumer Sentiment (final) | Steady | Steady | Inflation-expectations subindex is the key gold driver |
For each high-impact event, the reaction function is straightforward. If jobless claims or housing data beat forecasts (stronger economy), expect hawkish repricing and gold pressure toward $4,376.10 support.
If they miss forecasts (weaker economy), expect dovish repricing and a push toward $4,397.60.
Fed speakers carry the most asymmetric risk this week. A unified hawkish message could force gold below the MA50 at $4,378.00 and open the $4,344 four-hour downside target. A dovish shift, by contrast, gives bulls the fuel to attack $4,398 and beyond.
Technical Analysis
The technical picture is mildly bullish but unresolved: MA20 sits above MA50, RSI is neutral at 55.7, and price is trapped between $4,376.10 support and $4,397.60 resistance.
Moving Average Structure
On the H1 feed, MA20 prints at $4,379.00 and MA50 at $4,378.00 — a narrow $1.00 bullish spread. This is a constructive but fragile alignment: the trend bias is up, yet the margin is thin enough that a single bearish session could flip the crossover.
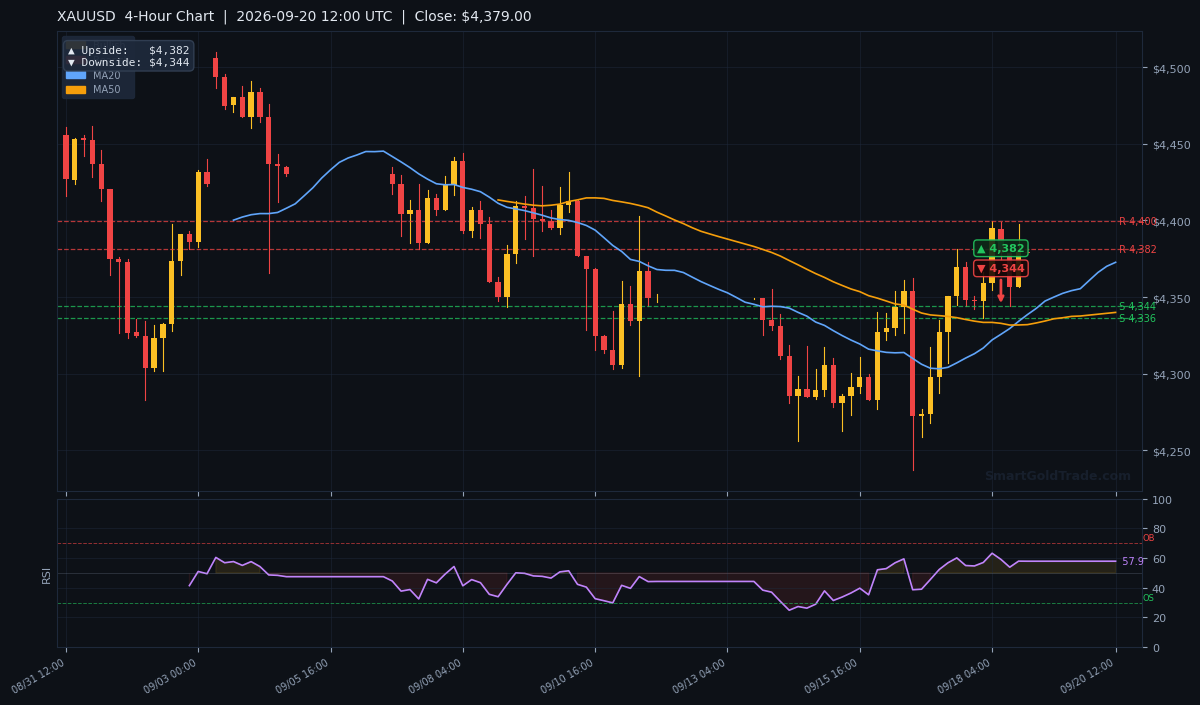
Price at $4,379.00 is sitting exactly on the MA20, meaning the market is at equilibrium. A sustained move above $4,382 (the four-hour upside target) would confirm the bulls retain control of the short-term trend.
RSI and Momentum
RSI(14) at 55.7 is squarely neutral — no overbought or oversold condition. This is important: there is no momentum exhaustion blocking an advance, and no oversold bounce signal supporting a reversal.
In practical terms, RSI at 55.7 favors continuation of the prevailing structure. A push above 60 would confirm bullish momentum toward $4,397.60; a drop below 45 would warn of a breakdown toward $4,344.
Key Support and Resistance Levels
These are the exact levels from the SmartGoldTrade H1 feed and pivot analysis:
- R2 resistance: $4,399.70
- R1 resistance: $4,397.60
- Current price: $4,379.00
- S1 support: $4,378.79
- S2 support: $4,376.10
- 1-Hour upside target: $4,398 | 1-Hour downside target: $4,379
- 4-Hour upside target: $4,382 | 4-Hour downside target: $4,344
- Daily upside target: $4,632 | Daily downside target: $4,333
The daily ATR-implied range for the week spans roughly $4,333 to $4,632 — a wide envelope that reflects elevated volatility expectations. Realistically, the tradeable week range sits between the four-hour targets of $4,344 and $4,382, with an expansion leg only on a decisive break of $4,398 or $4,376.
Trading Scenarios This Week
With price pinned to the MA20 and RSI neutral, the plan is to trade the break — not the middle of the range.
Bullish Scenario (probability 45%)
Trigger: an H1 close above $4,382, confirmed by RSI pushing through 60. This would validate the MA20-over-MA50 structure and open the pivot ceiling.
- Entry zone: $4,382–$4,385 on retest
- Target 1: $4,397.60 (R1)
- Target 2: $4,398 (1-hour upside target)
- Target 3: $4,399.70 (R2)
- Stop loss: $4,376.10 (below S2)
A clean break of $4,398 shifts the focus to the daily upside target at $4,632 over a multi-week horizon. Traders seeking automated execution of these levels can review price action trading system for gold tools that detect supply and demand zones mechanically.
Bearish Scenario (probability 35%)
Trigger: an H1 close below $4,376.10 (S2), with MA20 crossing back under MA50. That would invalidate the bullish structure and expose the four-hour downside target.
- Entry zone: $4,376–$4,374 on retest
- Target 1: $4,344 (4-hour downside target)
- Target 2: $4,333 (daily downside target)
- Stop loss: $4,385
A break of $4,344 opens the door to the $4,333 daily floor, where longer-term buyers would likely re-engage.
Neutral / Range-Bound Scenario (probability 20%)
If no catalyst forces a break, gold likely chops between $4,376.10 and $4,397.60. The mean-reversion play is to buy $4,377–$4,378 and sell $4,396–$4,397, with tight stops outside the band.
Range conditions favor patience over aggression. Investors building longer-term exposure during consolidation may find Shariah-compliant gold investment pools a structured alternative to short-term positioning.
Risk Factors to Watch
The primary risk is a surprise Fed communication shift — a hawkish pivot would break $4,376.10 and accelerate toward $4,344. An unexpected geopolitical escalation (US-Iran headlines) could spike gold through $4,398 in minutes.
The key invalidation level for the bullish bias is $4,376.10. A sustained break below it flips the weekly bias to neutral-to-bearish and targets $4,344 and $4,333. Conversely, $4,398 is the invalidation for the bearish case.
Key Takeaways
- Gold trades at $4,379.00, pinned to MA20 ($4,379.00) with MA50 just below at $4,378.00 — a bullish but fragile structure.
- RSI(14) at 55.7 is neutral, leaving room for a momentum expansion in either direction.
- The pivot ceiling is $4,397.60 (R1) and $4,399.70 (R2); a break targets $4,398 and eventually $4,632.
- The floor is $4,378.79 (S1) and $4,376.10 (S2); a break targets $4,344 and $4,333.
- Weekly bias: mildly bullish above $4,382, neutral between $4,376 and $4,398, bearish below $4,376.10.
- Fed speakers are the week's biggest asymmetric risk — more than the housing or sentiment data.
Conclusion
The weekly bias for gold is cautiously bullish while price holds above $4,376.10, with the MA20/MA50 alignment and neutral RSI both favoring an eventual test of $4,397.60. That said, the setup is a coiled range, not a trend — the market needs a catalyst to escape it.
The single most important level this week is $4,382. A sustained break above it confirms the bulls and opens $4,398 and the daily target at $4,632. A failure to reclaim it keeps gold range-bound between $4,376 and $4,398.
Traders should watch Fed speakers and Thursday's jobless claims closely, keep position sizes modest inside the range, and let the breakout — not the middle — define entries. The first H1 close outside $4,376.10–$4,397.60 sets the tone for the following week.
FAQ
- What is the gold price forecast for next week?
- Gold is expected to trade between $4,376.10 support and $4,397.60 resistance, with a mildly bullish bias while price holds above $4,382. A breakout targets $4,398 and then $4,632.
- What are the key support levels for XAU/USD this week?
- The key supports are $4,378.79 (S1), $4,376.10 (S2), $4,344 (4-hour downside target) and $4,333 (daily downside target).
- What are the key resistance levels for gold this week?
- Resistance sits at $4,382 (4-hour target), $4,397.60 (R1), $4,399.70 (R2) and $4,632 (daily upside target).
- Is gold bullish or bearish right now?
- Mildly bullish. MA20 at $4,379.00 sits above MA50 at $4,378.00, but RSI at 55.7 is neutral and price must clear $4,382 to confirm momentum.
- What economic events could move gold this week?
- Fed speaker remarks, US housing data, Thursday's jobless claims and Friday's consumer sentiment final print are the main drivers. A dovish shift supports a move toward $4,398; a hawkish shift pressures toward $4,376.
Trading Gold (XAU/USD) carries significant risk of loss and is not suitable for all investors. This content is for informational purposes only and does not constitute financial advice. Always conduct your own research and trade responsibly.