Gold Price Forecast Next Week: Bulls Defend $4,157 as $4,200 Resistance Looms (October 18–October 24, 2026)
Gold trades at $4,166.10 per troy ounce as the new week opens on October 18, 2026. Last week delivered a volatile two-way battle in which XAU/USD rallied toward $4,200, was rejected, and then found buyers near the $4,104–$4,157 zone.
This gold price forecast next week covers the October 18–October 24 trading week. It breaks down the price action that just occurred, the macro events on deck, the exact technical levels from the H1 and H4 feeds, and the bull, bear and range scenarios with entries, targets and stops.
The headline tension is simple. Bulls must reclaim $4,192 to open the door to $4,200 and beyond. Bears need a clean break of $4,157 to target $4,070. Price sits almost exactly between the two.
Last Week in Review
Last week was a fight between falling US yields and a resilient dollar, and gold finished it without a clear winner. The market tested both extremes of the recent range before settling near the middle.
Price Action Recap
XAU/USD opened the week under pressure and extended losses toward the $4,104 area, which marked a two-month low. Buyers stepped in there and drove a rebound above $4,150 as US yields and the dollar retreated.
Midweek, gold pushed toward $4,200 and briefly traded near $4,370 at the peak of the bounce, according to FXStreet. That rally failed as upside momentum faded and sellers re-emerged.
The week closed with price back near the $4,166 handle. The weekly candle carries a long upper wick, a sign that sellers remain active above $4,200 even as buyers defend the $4,100–$4,157 floor.
Key Events That Moved Gold
Last week's dominant driver was the retreat in US Treasury yields, which lowered the opportunity cost of holding bullion and supported the rebound from $4,104. The softer dollar added a second tailwind as the week progressed.
Fed commentary kept a lid on the rally. Markets continued to price December rate risk, and hawkish remarks from Fed officials capped XAU/USD near $4,200. FXEmpire noted that the softer dollar alone failed to sustain the move.
Rising yields late in the week weighed on the metal again, with StoneX flagging that gold could take a larger dive if yields continue to climb. The conflicting forces left gold caught between support and resistance.
Weekly Close Analysis
Gold closed at $4,166.10, roughly $9 above the S1 pivot at $4,157.20 and about $26 below R1 at $4,192.30. That is a neutral-to-slightly-bearish close inside the prior range.
The weekly structure is a rejection candle rather than a breakout. Bulls defended critical support near $4,104–$4,157, but they failed to hold the $4,200 handle, which keeps the medium-term bias cautious.
Next Week Economic Calendar & Gold Impact
The coming week is macro-light on tier-one US data but heavy on Fed communication and global flash PMIs. With no FOMC decision or CPI print scheduled, Fed speakers and yield direction will likely drive gold.
| Day | Event | Forecast | Previous | Gold Impact |
|---|---|---|---|---|
| Mon Oct 19 | Fed Governor Speech | — | Hawkish tone | Hawkish = bearish gold |
| Tue Oct 20 | Eurozone Flash PMIs | Mixed | Soft | Weak data = mild gold support |
| Wed Oct 21 | US Existing Home Sales | Firm | Soft | Beat = hawkish, bearish gold |
| Thu Oct 22 | US Jobless Claims | 220K | 218K | Miss = dovish, bullish gold |
| Fri Oct 23 | US Flash PMIs | 52.0 | 51.4 | Beat = risk-on, bearish gold |
Monday's Fed speaker is the first catalyst. A hawkish tone that reiterates December rate risk would pressure gold toward $4,157. A dovish or neutral message opens a run at $4,192.
Tuesday's Eurozone flash PMIs matter through the dollar channel. A weak print lifts the dollar and weighs on XAU/USD; a strong print supports risk appetite and can pull gold lower too, so watch the yield reaction first.
Thursday's jobless claims are the week's cleanest directional signal. A miss (claims above 220K) is dovish and bullish gold, targeting $4,192–$4,201. A beat supports yields and pressures $4,157.
Technical Analysis
The technical picture is balanced with a bearish tilt. Price sits on the MA20, below the MA50, and RSI is dead-center at 49.0, giving no momentum edge to either side.
Moving Average Structure
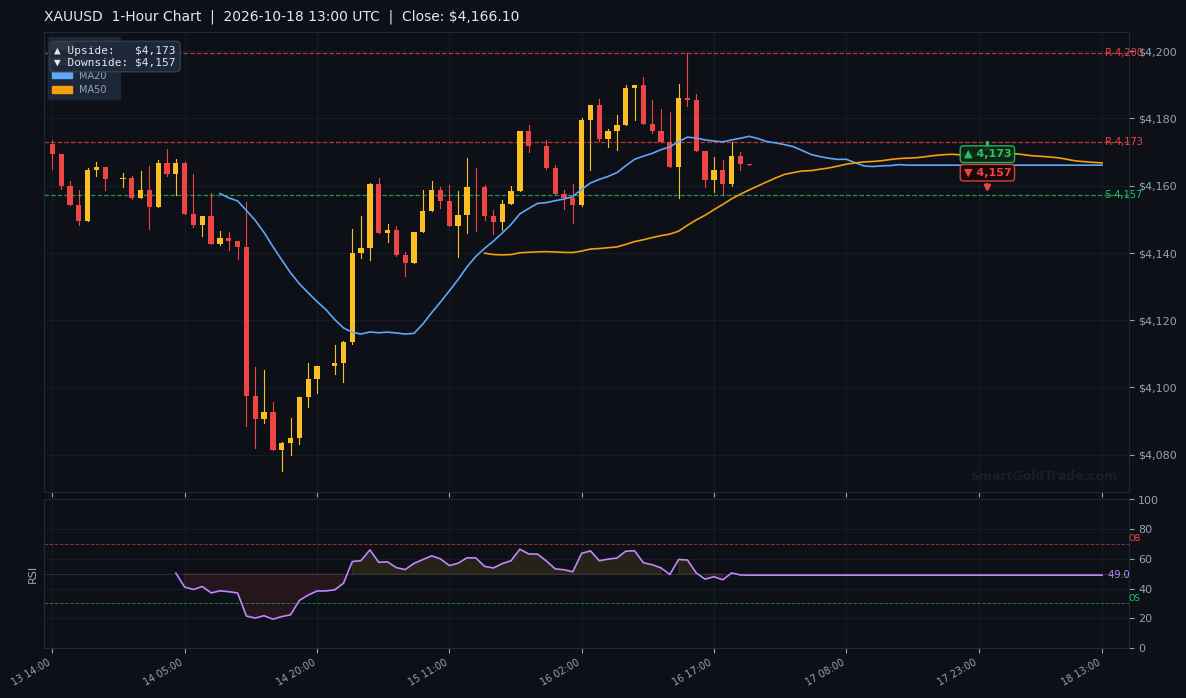
On the H1 feed, MA20 reads $4,166.10 and MA50 reads $4,166.80. That is a bearish cross, with the shorter average below the longer one, and price pinned directly on the MA20.
The configuration is a compression signal rather than a trend signal. The $0.70 gap between the averages is tiny, so a decisive break either way will quickly flip the alignment.
RSI and Momentum
RSI(14) at 49.0 is squarely neutral, sitting between the 30 oversold and 70 overbought thresholds. There is no divergence and no exhaustion signal in either direction.
Neutral RSI inside a compressed range favors range-trading tactics over breakout chasing. Momentum will only become actionable once RSI clears 55 or breaks 45.
Key Support and Resistance Levels
- R2: $4,199.50 — the ceiling of the recent range
- R1: $4,192.30 — first resistance, must clear to test $4,200
- Current price: $4,166.10
- S1: $4,157.20 — the line in the sand for bulls
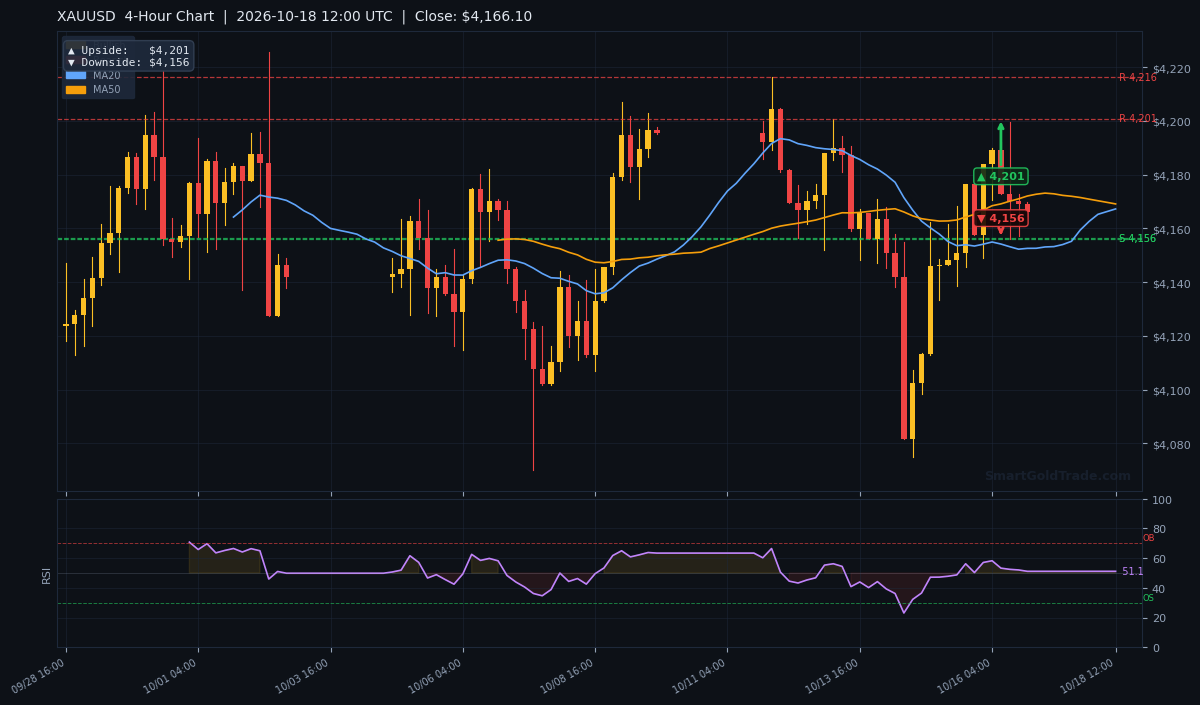
- 4H upside target: $4,201
- 4H downside target: $4,156
- 1H upside target: $4,173
- 1H downside target: $4,157
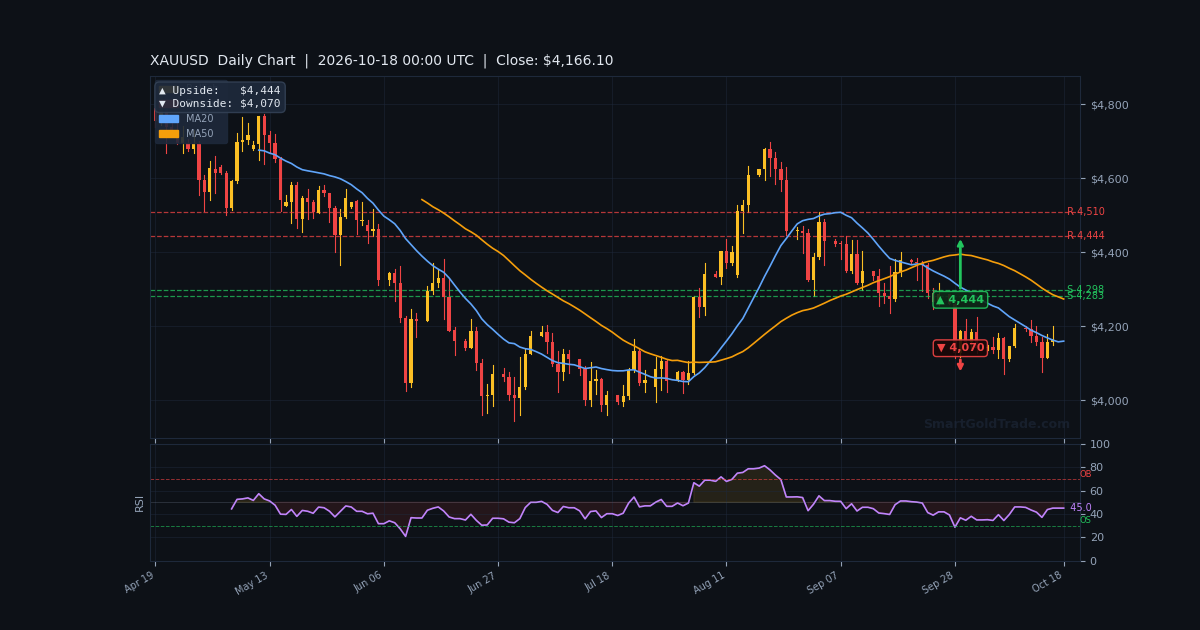
- Daily upside target: $4,444
- Daily downside target: $4,070
The ATR-implied weekly range, based on recent volatility, is roughly $4,110 to $4,225. That frames the realistic extremes for the week and aligns with the $4,070 daily downside and $4,201 4H upside targets.
The 1H targets are tight, $4,157 to $4,173, confirming the intraday compression. The 4H targets of $4,156 and $4,201 define the wider box that must break for a trend to emerge.
Trading Scenarios This Week
Three setups matter this week: a bull breakout above $4,192, a bear breakdown below $4,157, and a range trade between them. Position sizing should reflect the compressed ATR and the lack of tier-one data.
Bullish Scenario (probability 35%)
Trigger: an H1 close above $4,192.30, ideally on falling yields and a softer dollar. Entry zone: $4,192–$4,195 on a retest.
- Entry: $4,192–$4,195
- Target 1: $4,201 (4H upside)
- Target 2: $4,225 (ATR upper band)
- Stop loss: $4,183 (below the breakout level)
Confirmation requires RSI pushing above 55 and MA20 crossing back above MA50. Without both, treat the breakout as a liquidity grab.
Bearish Scenario (probability 45%)
Trigger: an H1 close below $4,157.20, with rising US yields and a firmer dollar. Entry zone: $4,155–$4,152 on a failed retest of S1.
- Entry: $4,155–$4,152
- Target 1: $4,110 (ATR lower band)
- Target 2: $4,070 (daily downside)
- Stop loss: $4,168 (back above MA20)
This is the higher-probability path because the MA20/MA50 cross is bearish and the weekly candle rejected $4,200. A break of $4,104 would confirm the bearish continuation.
Neutral / Range-Bound Scenario (probability 20%)
If price holds between $4,157 and $4,192 into midweek, trade the range. Buy $4,157–$4,160 with a stop at $4,150, targeting $4,185. Sell $4,190–$4,192 with a stop at $4,200, targeting $4,165.
Mean reversion works while RSI stays between 45 and 55. Exit the range trade the moment either boundary closes decisively.
Risk Factors to Watch
The biggest risk is a hawkish Fed surprise that drives yields sharply higher, which would invalidate the bull case and accelerate a move toward $4,070. A sudden dollar spike is the second key threat.
On the upside, a dovish Fed speaker or a weak jobless claims print could force a short squeeze through $4,200, opening $4,225 and eventually the $4,444 daily target. A close above $4,200 flips the weekly bias bullish.
Geopolitical headlines remain a wildcard. Any risk-off shock would support gold regardless of the technical setup, so keep stops mechanical and avoid oversized positions into the Friday PMI release.
Key Takeaways
- Gold opens the week at $4,166.10, pinned to the MA20 with a bearish MA20/MA50 cross at $4,166.80.
- RSI at 49.0 is neutral — no momentum edge for bulls or bears.
- Pivotal support is $4,157.20; a clean break targets $4,110 and then $4,070.
- Pivotal resistance is $4,192.30; a break opens $4,201 and $4,225.
- Thursday's jobless claims and Monday's Fed speaker are the week's top catalysts.
- Bias is cautiously bearish (45%) versus bullish (35%) and range-bound (20%).
Conclusion
The weekly bias is cautiously bearish while gold holds below $4,192.30. The bearish MA cross and the rejection wick at $4,200 favor sellers, but the defense of $4,104–$4,157 keeps the downside contained for now.
The single most important level is $4,157.20. A daily close below it confirms the bearish path toward $4,110 and $4,070. A daily close above $4,192.30 flips the bias and targets $4,201 and $4,225.
For traders who want to act on this gold price forecast next week, the cleanest approach is to wait for an H1 close beyond either pivot rather than front-running the break. If you prefer to follow expert setups, you can professional gold trading signals for real-time entry and exit alerts. And if you'd rather hold the metal itself, SmartGoldTrade lets you buy certified gold coins and bars with physical ownership by the gram.
Risk disclaimer: This article is for informational purposes only and does not constitute investment advice. Gold trading involves significant risk, including the possible loss of principal. Past performance is not indicative of future results. Always do your own research and consult a qualified financial advisor before making any trading or investment decisions.
FAQ
What is the gold price forecast next week?
For October 18–24, 2026, the bias is cautiously bearish. Gold sits at $4,166.10, with a bearish MA20/MA50 cross and neutral RSI. A break below $4,157.20 targets $4,110 and $4,070, while a close above $4,192.30 opens $4,201 and $4,225.
What are the key support and resistance levels for XAU/USD?
Support sits at $4,157.20 (S1), with deeper floors at $4,110 and $4,070. Resistance is at $4,192.30 (R1) and $4,199.50 (R2), with upside targets at $4,201 and $4,225.
Which events could move gold the most next week?
Monday's Fed speaker and Thursday's US jobless claims are the top catalysts. A hawkish Fed tone pressures gold toward $4,157, while a weak claims print (above 220K) could push it through $4,192 toward $4,201.
Trading Gold (XAU/USD) carries significant risk of loss and is not suitable for all investors. This content is for informational purposes only and does not constitute financial advice. Always conduct your own research and trade responsibly.