The gold price holds $4,119.12 in the Asian session, clinging to a fragile ledge after Tuesday's slide below the $4,150 mark. Monday's Iranian military statement on the Strait of Hormuz — and the threat to extend the blockade to Bab al-Mandeb and Suez — continues to ripple through energy markets, lifting oil-driven inflation fears that weigh on the yellow metal. With the Fed's October 27–28 meeting now less than a week away and futures pricing only a 16.1% chance of a quarter-point hike, traders are caught between geopolitical risk and a firmer dollar. This session is not about chasing — it is about preparing for the next decisive move.
Gold Market Overview
Macro Context
The dollar is the immediate headwind. The DXY firmed to 101.66 on Tuesday as European equities slumped on French political unrest, and that strength has carried into early Asian trade. US 10-year Treasury yields eased toward 5.123% on Iran deal hopes, but the 2-year sits flat at 4.789% — the market is not yet pricing relief. Fed Chair Kevin Warsh's speech last week scored 5.6/10 on the FXS Speechtracker, reinforcing a pause bias while keeping options open into December.
Geopolitically, the Middle East premium remains live. The Houthis claimed attacks on King Khalid International Airport and Saudi Aramco facilities, and Brent crude settled at $109.55. Higher energy costs feed directly into the inflation narrative that keeps real yields elevated — a structural drag on a non-yielding asset like gold.
Session Outlook
Asian liquidity is thin, and the ADX reading of 18.5 confirms a weak, ranging tape. Expect the gold price to respect the $4,111.68 to $4,127.01 band through the session. Do not chase breakouts on low volume — false moves are the norm here. The real trigger comes later this week with US Initial Jobless Claims on Thursday and S&P Global Flash PMIs on Friday.
Technical Analysis
Moving Average Structure
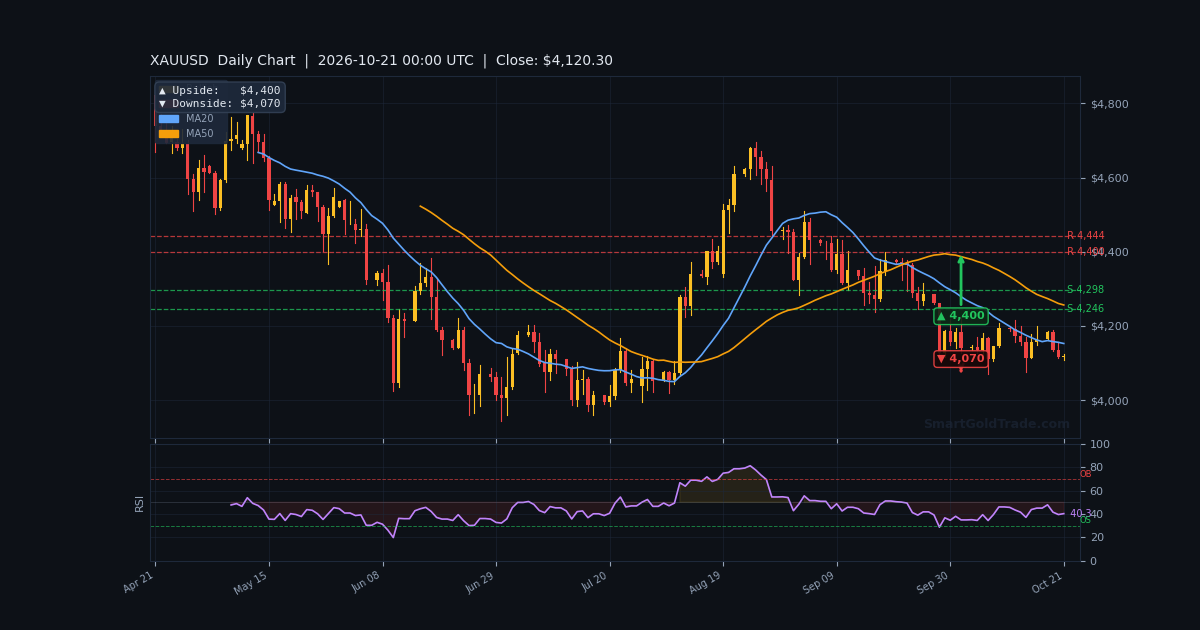
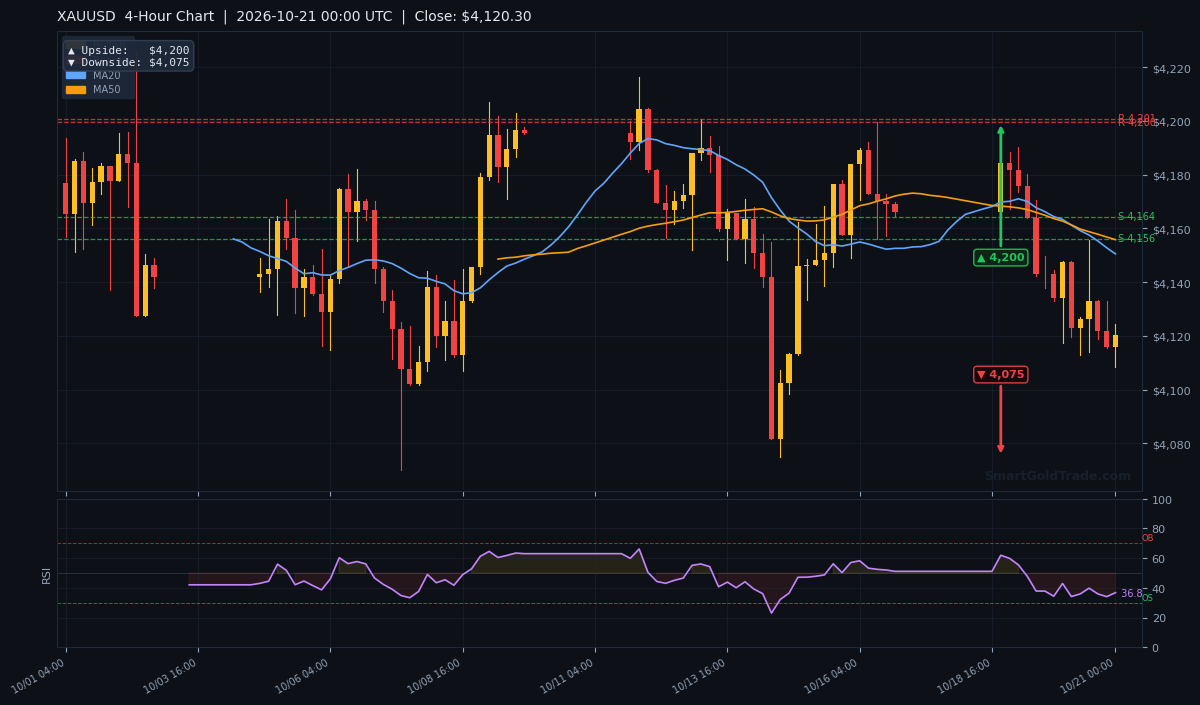
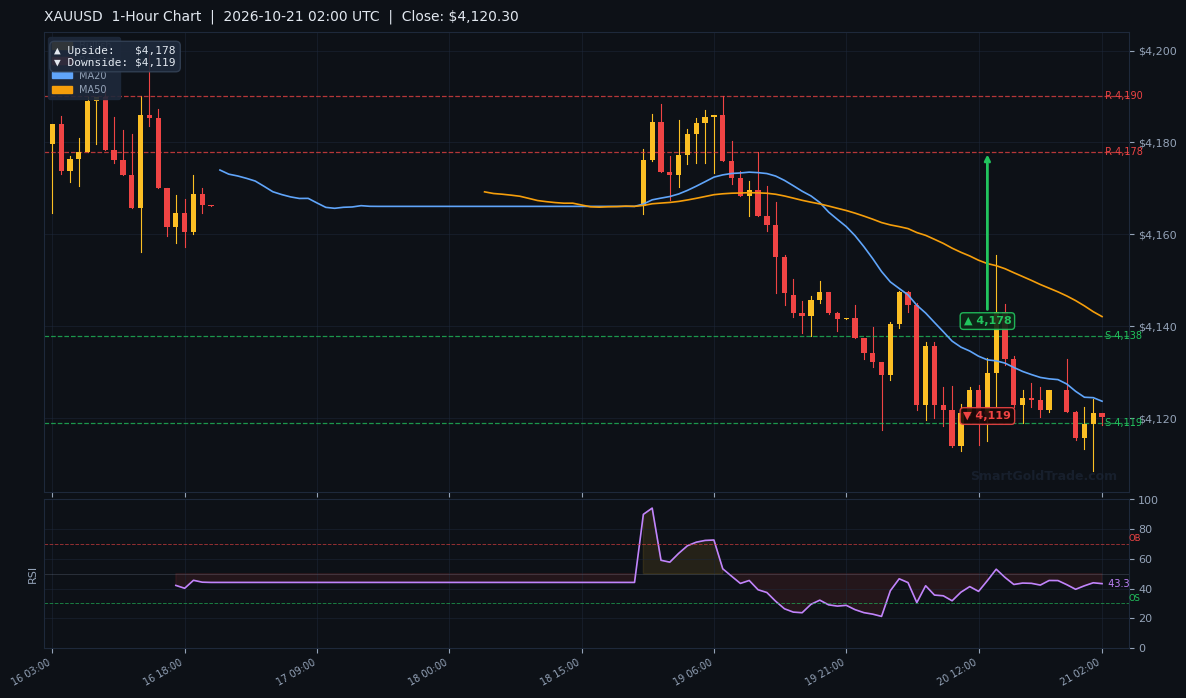
The EMA20 at $4,125.50, EMA50 at $4,137.41, and EMA200 at $4,153.97 are stacked in bearish order, with price trading below all three. That is a clean bear structure on the H1 chart. The H4 EMA200 at $4,222.22 and D1 EMA200 at $4,291.34 confirm the higher-timeframe downtrend remains intact.
RSI and Momentum
RSI(14) at 43.6 sits in neutral territory — no oversold bounce signal, no overbought exhaustion. Stochastic at 14.6/15.3 is deeply oversold on the short term, hinting at a possible relief bounce, but MACD at -6.38 with a histogram of +0.36 shows momentum flattening rather than reversing. Translation: the bounce, if it comes, is corrective, not a trend change.
Key Price Levels
Immediate support rests at S1 $4,115.58 and S2 $4,111.68 — the latter also marks the prior day's low. Resistance sits at R1 $4,127.01 and R2 $4,143.43. The ATR(14) of $12.22 (0.30% of price) defines the expected hourly range, so a session move beyond $4,107 or $4,131 would be an outlier worth noting. VWAP at $4,117.26 sits just below price, a mild bullish tilt within a bearish structure.
| Timeframe | Upside Target | Downside Target |
|---|---|---|
| Daily | $4,400 | $4,070 |
| 4-Hour | $4,200 | $4,075 |
| 1-Hour | $4,178 | $4,119 |
Fundamental Drivers
The dominant driver this week is the Middle East energy story. Iran's threat to widen its blockade beyond Hormuz keeps oil bid and inflation expectations sticky, which paradoxically pressures gold by reinforcing the higher-for-longer rate narrative. Commerzbank noted gold fell 0.6% to $4,141 on Tuesday as Brent eased 0.3% to $109.55 — the correlation is running hot.
On the Fed side, Warsh's cautious tone and the 16.1% October hike probability leave the market in limbo. A pause is largely priced, so the risk is a hawkish surprise in guidance rather than the decision itself.
Key Event to Watch
Thursday's US Initial Jobless Claims is the single most important print this week. A hot number would revive tightening fears and likely push the gold price toward $4,111.68. A soft print could spark a relief bounce toward $4,127.01.
Devil's Advocate
The bearish bias has a clear invalidation point: a sustained H1 close above R1 $4,127.01, which would put the EMA20 at $4,125.50 back in play as support. From there, a push through R2 $4,143.43 would flip the short-term structure and open the door to the H4 EMA200 at $4,222.22. Conversely, a break below S2 $4,111.68 on volume confirms the next leg lower toward the daily downside target of $4,070. Watch the volume — thin Asian tape produces false breaks.
Trading Strategy for Asian Session
Patience is the trade. The gold price is pinned between $4,111.68 and $4,127.01, and the ADX at 18.5 tells you the market has no directional conviction. Aggressive entries here are a donation to the spread.
For a short setup, wait for a rejection at R1 $4,127.01 with a stop above $4,135 (roughly one ATR of $12.22 from entry) and a target at S1 $4,115.58, then S2 $4,111.68. For a long setup, a confirmed bounce off S2 $4,111.68 with a stop below $4,104 targets $4,127.01 and $4,143.43. Position size should be half of normal given the liquidity. If you need a structured framework, professional gold trading signals can help time entries around these levels.
Key Takeaways
- Gold price holds $4,119.12, below all three H1 EMAs — bear structure intact.
- Immediate support at S1 $4,115.58 and S2 $4,111.68; resistance at R1 $4,127.01.
- RSI 43.6 neutral, ADX 18.5 weak — expect range-bound Asian trade.
- ATR $12.22 defines the session range; avoid chasing moves beyond $4,131 or $4,107.
- Fed October meeting (Oct 27–28) prices only 16.1% hike odds — pause largely baked in.
- Daily downside target $4,070 remains live if $4,111.68 breaks on volume.
Conclusion
The gold price bias for the Asian session is cautiously bearish, but the tape is too thin to force a trade. Price sits below the EMA200 at $4,153.97, momentum is flat, and the ADX confirms a range. The line in the sand is $4,111.68 — hold it and a corrective bounce toward $4,127.01 is possible; lose it on volume and $4,070 comes into view. Prepare, don't chase. For those building longer-term exposure, buy certified gold coins and bars offers a tangible alternative to leveraged spot positions.
Frequently Asked Questions
- What is the gold price right now?
- The gold price is $4,119.12 in the Asian session, holding above S1 support at $4,115.58.
- Will gold break below $4,111 support today?
- A break requires volume confirmation. S2 at $4,111.68 is the prior day's low and a key pivot — a sustained close below targets $4,070.
- What is the key resistance for gold price?
- R1 sits at $4,127.01, with R2 at $4,143.43. A close above R1 would invalidate the short-term bearish bias.
- How does the Fed meeting affect gold this week?
- The October 27–28 meeting prices only 16.1% hike odds, so a pause is largely baked in. A hawkish guidance surprise would pressure gold toward $4,111.68.
- Is now a good time to trade gold?
- Asian liquidity is thin and ADX is 18.5 — wait for clear rejection at $4,127.01 or a confirmed bounce at $4,111.68 before committing size.
Trading Gold (XAU/USD) carries significant risk of loss and is not suitable for all investors. This content is for informational purposes only and does not constitute financial advice. Always conduct your own research and trade responsibly.