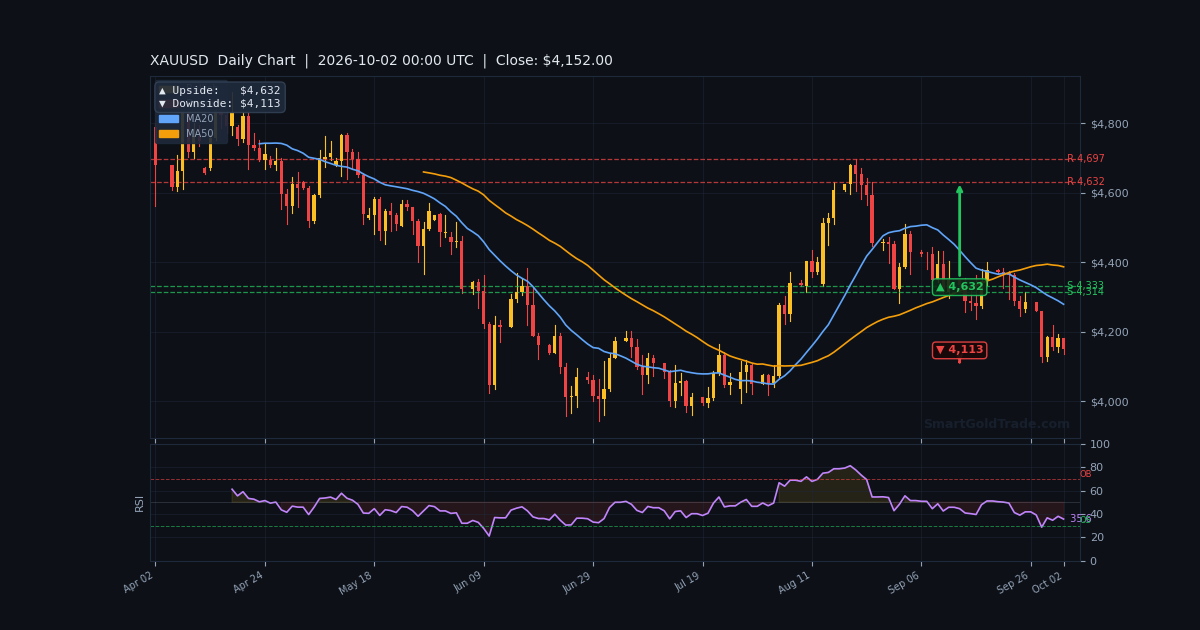
The gold price is holding near $4,151.59 in a quiet Asian session, pinned just above the pivotal $4,149.18 support. This comes after Thursday's choppy trade, which saw the metal fail below $4,200 and close lower. Traders are now positioning ahead of Friday's US Nonfarm Payrolls report, a key event that could dictate the next major move.
Liquidity is thin, and the market feels heavy. The US Dollar remains firm near a one-and-a-half-year top, while Treasury yields hover near multi-decade highs. With momentum indicators pointing lower, this session is about preparation, not chasing. We are watching to see if this critical support level holds or gives way to a deeper correction.
Gold Market Overview
Macro Context
The broader macro backdrop remains a headwind for the gold price. The US Dollar Index (DXY) is firm, supported by oil-driven inflation fears and safe-haven flows from the ongoing US-Iran standoff. This strength in the Greenback is a classic pressure point for dollar-denominated gold.
Meanwhile, US Treasury yields, while slightly retreating from recent peaks, remain elevated. The 10-year yield is hovering near 5.24%, keeping the opportunity cost of holding non-yielding bullion high. This environment has capped gold's upside, despite lingering geopolitical uncertainty.
Session Outlook
The Asian session is expected to be quiet, with liquidity thin ahead of the US jobs data. We anticipate the gold price to remain range-bound between $4,149 and $4,188. The primary trigger for any volatility will be headlines from the Middle East or any pre-NFP positioning flows.
Traders should be patient. Low-volume breakouts are often unreliable. The market is in a wait-and-see mode, and it is wise to follow its lead. The real action will likely begin during the London and New York sessions.
Technical Analysis
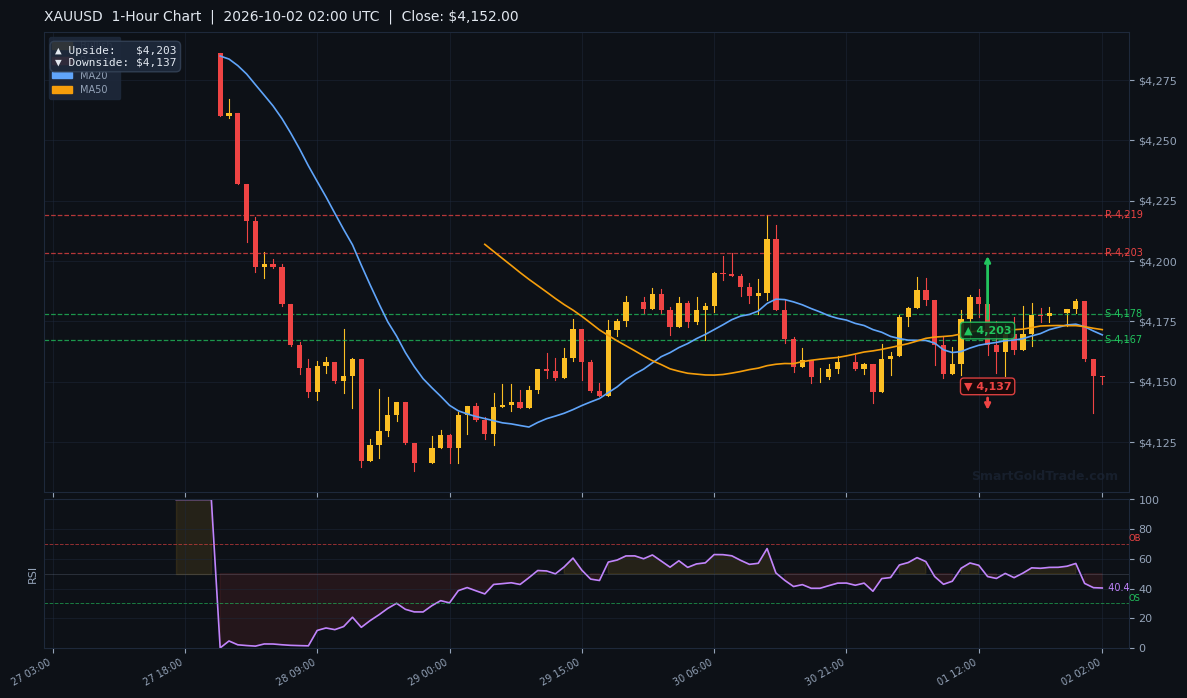
The technical picture for the gold price is clearly bearish on the intraday charts. Price is trading below all key moving averages, and momentum is weak. The market is currently testing a critical support zone that will determine the short-term direction.
Moving Average Structure
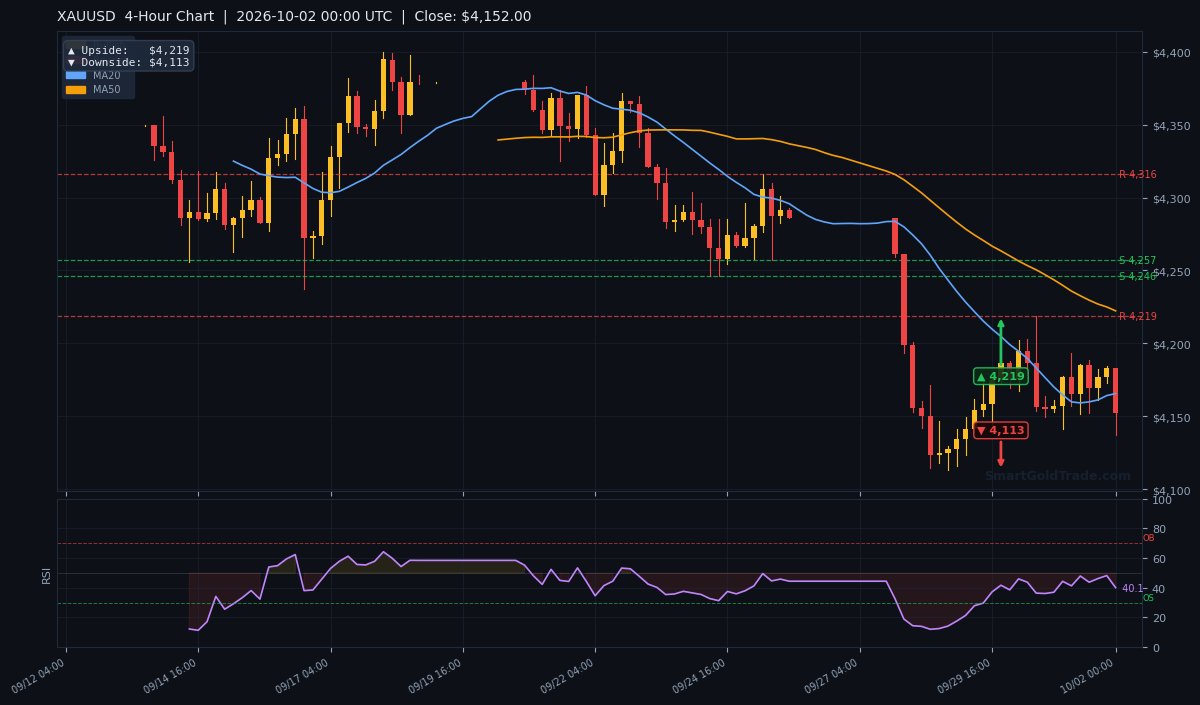
The EMA20 at $4,168.73 and EMA50 at $4,170.36 are both acting as immediate resistance. More importantly, the EMA200 at $4,224.66 is far above the current price, confirming a strong bearish structure. For any bullish reversal to be considered, price must first reclaim these levels.
RSI and Momentum
The RSI(14) is at 41.0, which is in the neutral range but leaning bearish. It is not yet oversold, suggesting there is room for further downside. The MACD is negative at -0.72, with a widening histogram, indicating that bearish momentum is still in control.
Key Price Levels
Immediate support is seen at the S1 level of $4,150.18 and the S2 level of $4,149.18. A break below this zone could accelerate a move toward the daily downside target of $4,113. On the upside, resistance is at R1 $4,187.68 and R2 $4,193.09. The ATR(14) of $16.45 suggests an expected hourly range of roughly $16.
Fundamental Drivers
The most significant news this morning was Japan's Tokyo CPI data, which showed core inflation rising to 2.7% year-over-year, above expectations. This has fueled speculation that the Bank of Japan could adjust its ultra-loose policy, potentially strengthening the Yen and causing ripples in global bond markets.
However, the spotlight remains firmly on the US. The market has recently shifted its expectations, now pricing a higher chance of a Fed rate hike in December. This hawkish repricing supports the US Dollar and weighs on the gold price.
Key Event to Watch
The single most important event this week is Friday's US Nonfarm Payrolls report. Economists expect an increase of 90,000 jobs, with the unemployment rate holding at 4.1%. A stronger-than-expected report would reinforce the case for a Fed hike, likely sending the gold price below the $4,149 support level.
Devil's Advocate
The main bearish thesis could be invalidated by a sudden escalation in the Middle East, which would trigger safe-haven demand for gold. A surprise miss in the US jobs data could also weaken the Dollar and spark a short-covering rally.
The key reversal level to watch is $4,193.09 (R2). A decisive close above this level would signal a shift in momentum and could invalidate the bearish outlook. Until then, the path of least resistance remains lower.
Trading Strategy for Asian Session
Given the low liquidity and bearish bias, a patient, sell-the-rally approach is favored. Look for the gold price to rally into the $4,168–$4,170 zone (EMA20/50) to initiate a short position.
Place a stop-loss above the $4,187 resistance level (R1), using the ATR of $16.45 as a guide. The first take-profit target would be the $4,149 support zone. A break below this level opens the door for a move toward $4,137 and then the daily target of $4,113. For those looking to automate these strategies, exploring automated candlestick pattern detection can be useful. Alternatively, for a hands-off approach, one might consider copy trading to follow experienced analysts.
Key Takeaways
- The gold price is bearish below the $4,168 EMA20, currently testing critical support at $4,149.
- Momentum indicators (RSI 41.0, MACD -0.72) confirm weak sentiment and room for further downside.
- Immediate resistance is at $4,187.68 (R1); a break above this level would neutralize the bearish bias.
- The primary risk event is Friday's US NFP report, which could dictate the next $50+ move.
- Thin Asian liquidity warns against chasing breakouts; patience is key.
- Downside targets are $4,137 (1H chart) and $4,113 (Daily chart) if support fails.
Conclusion
The gold price is at a crossroads, holding just above the $4,151 level in a tense, low-volume session. The technical structure is bearish, and the fundamental backdrop is unsupportive, but a major support zone is providing a temporary floor. The next directional move will likely be triggered by the US jobs data. For today's Asian session, expect a quiet, range-bound market. The bias remains bearish, but patience is required until a clear break of either $4,149 or $4,188 occurs.
Frequently Asked Questions
- What is the current gold price?
- The gold price is currently $4,151.59, trading in a tight range during the Asian session.
- What are the key support levels for gold?
- The immediate support levels are $4,150.18 (S1) and $4,149.18 (S2). A break below this zone could lead to a test of the $4,113 daily target.
- What is the most important resistance level right now?
- The key resistance is at the R1 level of $4,187.68. A sustained move above this level would suggest a potential trend reversal.
- How will the US NFP report affect the gold price?
- A strong NFP report will likely strengthen the US Dollar and push the gold price below $4,149. A weak report could trigger a rally toward $4,188.
Trading Gold (XAU/USD) carries significant risk of loss and is not suitable for all investors. This content is for informational purposes only and does not constitute financial advice. Always conduct your own research and trade responsibly.