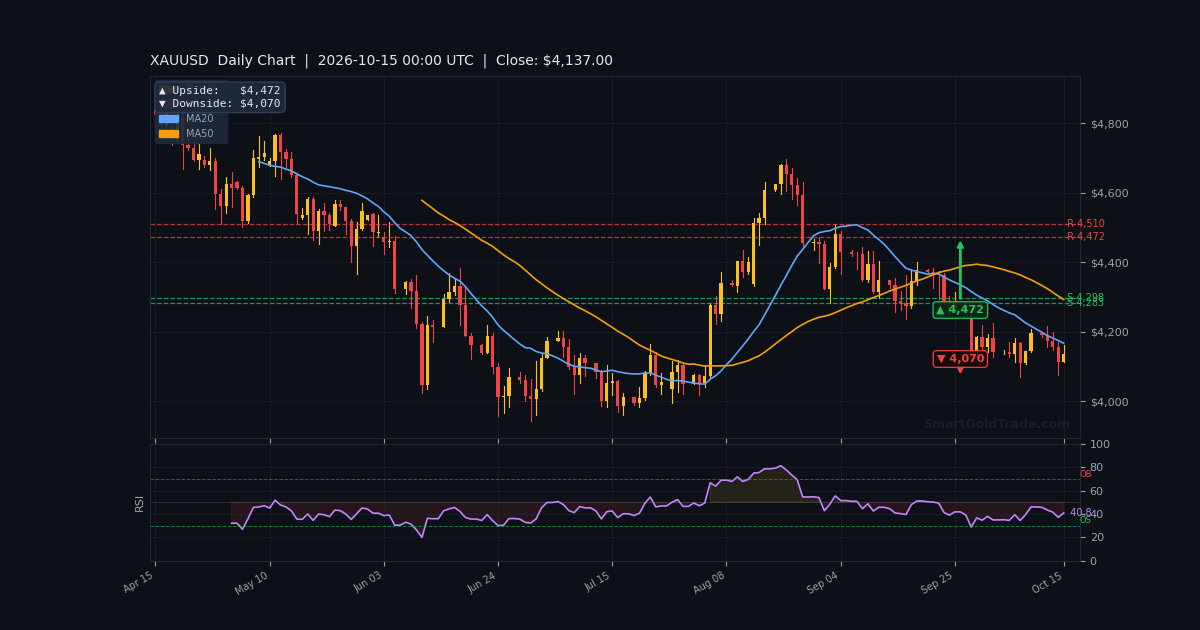
The gold price has clawed back to $4,146.20 in early European trading after Wednesday's CPI-driven sell-off found a floor near $4,073.55. The rebound gained traction overnight following a Bloomberg report that China is quietly accumulating US Treasuries through non-US custodians, a disclosure that sent yields sharply lower and revived demand for the yellow metal.
That move reversed a three-day losing streak and pushed XAU/USD back above the VWAP at $4,138.84. With London desks now live, the question is whether this bounce has legs or simply marks a pause before the next leg down.
This session will determine if bulls can reclaim the $4,144.81 MA50 or if the broader bearish structure reasserts control.
Gold Market Overview
Macro Context
The US Dollar Index skidded below 102.00 on Thursday, extending losses as markets digested September's hotter CPI print. Headline inflation accelerated to 3.7% annually while core rose 2.6%, both above consensus.
Yet the dollar failed to hold gains, suggesting the market believes the Fed will remain patient rather than rush another hike. San Francisco Fed President Mary Daly reinforced that view, signalling no urgency to tighten at the October meeting despite acknowledging persistent price pressures.
US Treasury yields retreated across the curve, removing a key headwind for gold. Geopolitical risk remains elevated, with escalating Middle East tensions and concerns over AI-driven debt expansion continuing to underpin safe-haven flows into bullion.
Session Outlook
European liquidity arrives with gold trapped between $4,133.72 support and $4,143.43 resistance. The ATR of $12.37 suggests an expected hourly range of roughly 0.30%, leaving room for a test of either boundary.
Watch for momentum acceleration if price clears the VWAP decisively. A sustained break above $4,143 opens the door to $4,152.27, while failure risks a slide back toward $4,125.28.
Traders should stay alert for headline risk as US participants await Retail Sales and PPI data later today.
Technical Analysis
Moving Average Structure
Price at $4,146.20 sits between the MA20 at $4,116.09 and the MA50 at $4,144.81, with the shorter average below the longer one — a bearish configuration that has yet to be invalidated. The two averages are tightly clustered, creating a compression zone that often precedes directional expansion.
On the higher timeframes, the H4 EMA200 at $4,241.00 and D1 EMA200 at $4,297.30 loom well above current price, underscoring the medium-term downtrend.
RSI and Momentum
The RSI(14) reads 56.8, placing momentum in neutral territory with no overbought or oversold signal. Stochastic at 78.9/84.3 leans toward the upper end, hinting at short-term exhaustion risk if price fails to advance.
MACD at -0.18 with a positive histogram of +6.86 suggests bearish momentum is fading. The ADX at 34.2 confirms a strong trend environment, meaning moves are likely to extend once direction resolves.
Key Price Levels
Immediate support rests at $4,133.72 (S1), with a deeper floor at $4,125.28 (S2). To the upside, resistance sits at $4,143.43 (R1) and $4,152.27 (R2).
The Bollinger Bands span from $4,117.11 to $4,167.88, framing the expected range. A move through either band would signal a volatility expansion.
Session marks to monitor: previous day high at $4,170.49, previous day low at $4,073.55, prior week high at $4,207.49, and prior week low at $4,066.54.
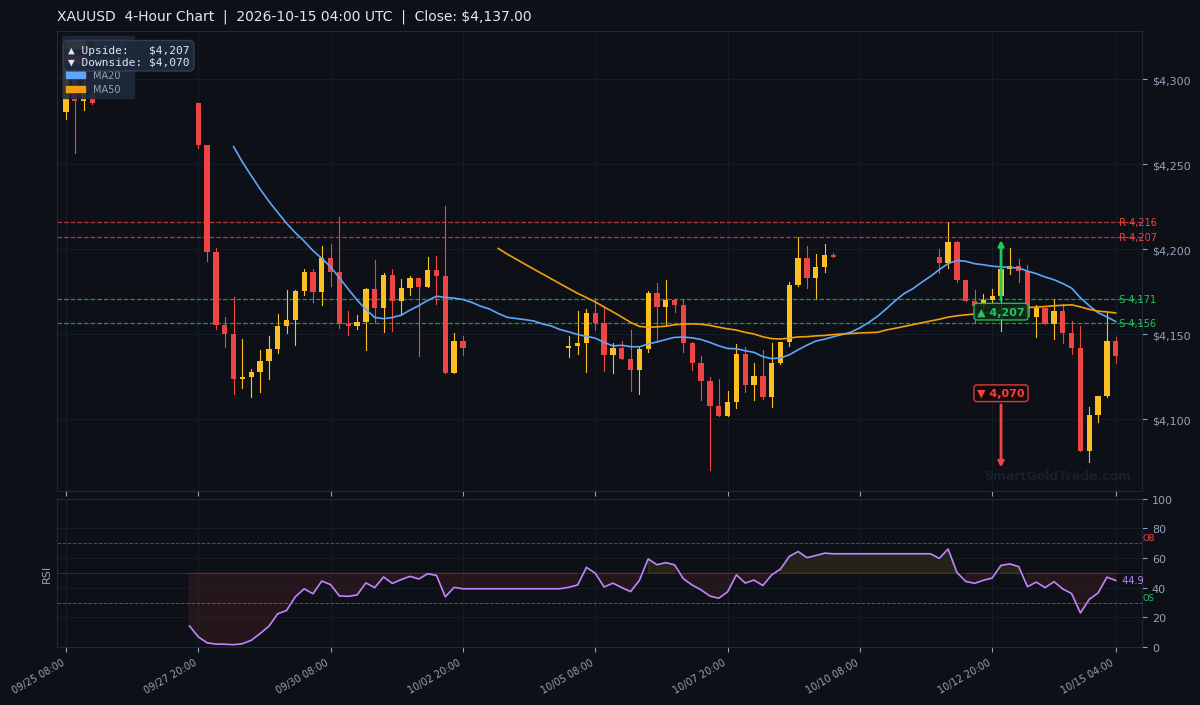
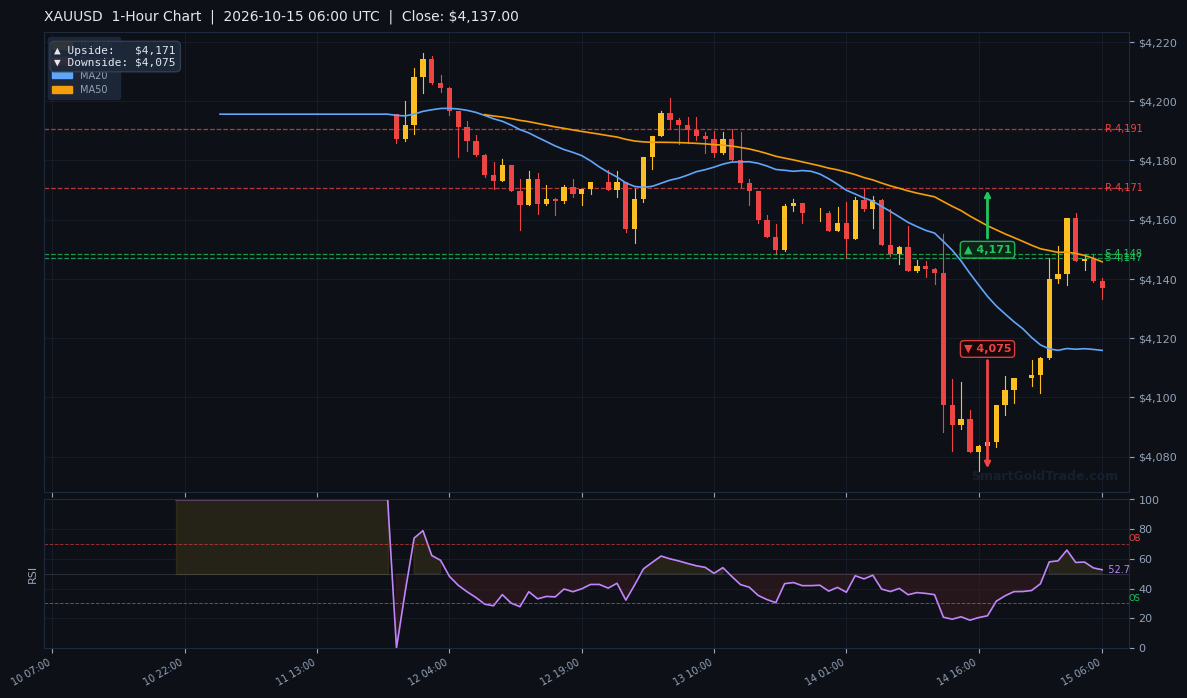
| Timeframe | Upside Target | Downside Target |
|---|---|---|
| Daily | $4,472 | $4,070 |
| 4-Hour | $4,207 | $4,070 |
| 1-Hour | $4,171 | $4,075 |
Fundamental Drivers
Wednesday's US CPI report showed headline inflation accelerating to 3.7% year-over-year, with core rising 2.6% — both above forecasts. The initial knee-jerk sell-off drove gold to a one-week low before buyers stepped back in.
The recovery was supercharged by Bloomberg's report that China is accumulating US Treasuries through non-US custodians, inflating Canada's holdings to nearly $600 billion. This disclosure pressured yields lower and weakened the dollar, providing a direct tailwind for gold.
Fed sentiment remains cautiously hawkish. The FXS Fed Sentiment Index slipped 0.84 points to 128.17, still well above neutral but reflecting a more measured approach. Markets now price a 42% probability of an October hike, up from 22% before CPI but well below panic levels.
Key Event to Watch
Friday's fireside chat with Fed Chairman Kevin Warsh in Bangkok marks his final public appearance before the blackout period ahead of the October 27-28 meeting. Any hawkish signal could reignite dollar strength and pressure gold back toward $4,125.
Devil's Advocate
The bullish case rests on a fragile foundation. The rebound from $4,073 was driven by a single news report, not a structural shift in Fed policy. If Friday's Warsh comments lean hawkish, or if today's Retail Sales and PPI data surprise to the upside, the dollar could reverse sharply.
A daily close below $4,125.28 would invalidate the bounce and expose $4,073.55 once more. The bearish moving-average structure — price below the MA50 at $4,144.81 — remains the dominant technical signal. Bulls need a close above $4,152.27 to flip the near-term bias.
Trading Strategy for European Session
For momentum traders, a long entry above $4,143.43 with a stop at $4,128 (roughly one ATR below entry) targets $4,152.27 initially, with $4,171 as the extended objective. This setup aligns with the 1-hour chart's upside arrow.
Alternatively, a rejection at $4,143 offers a short opportunity targeting $4,133.72 and then $4,125.28. Place stops above $4,148 to limit risk. The ADX at 34.2 supports trend continuation once direction is confirmed.
Position sizing should account for the ATR of $12.37 — wider stops are necessary in this volatility regime. Avoid chasing price mid-range between $4,133 and $4,143; wait for a clean break.
For traders seeking structured entry points, professional gold trading signals can provide real-time alerts aligned with these technical levels.
Key Takeaways
- Gold price at $4,146.20, rebounding from Wednesday's low of $4,073.55.
- Price below the MA50 at $4,144.81 — bearish structure intact.
- Immediate resistance at $4,143.43; support at $4,133.72.
- RSI at 56.8 signals neutral momentum with room to move either way.
- China Treasury report weakened USD and yields, fueling the bounce.
- Fed Chair Warsh speaks Friday — key risk event before blackout period.
Conclusion
The gold price sits at a critical juncture as European traders take the reins. The rebound to $4,146.20 has restored some bullish confidence, but the broader structure remains bearish while price trades below the MA50 at $4,144.81.
A decisive break above $4,143.43 would open the path toward $4,152.27 and potentially $4,171. Conversely, failure to hold $4,133.72 exposes $4,125.28 and the prior low at $4,073.55.
With ADX confirming strong trend conditions and today's US data releases on deck, expect volatility to remain elevated. Trade the levels, respect the stops, and let the market confirm direction before committing size.
For those looking to build a longer-term position in the metal rather than trade the intraday swings, SmartGoldTrade offers a straightforward way to buy certified gold coins and bars with full physical ownership.
Frequently Asked Questions
- What is driving the gold price rebound today?
- The gold price rebounded to $4,146.20 after a Bloomberg report revealed China is accumulating US Treasuries through non-US custodians. This pressured yields lower and weakened the dollar, reviving demand for bullion after Wednesday's CPI-driven sell-off to $4,073.55.
- What are the key resistance levels for gold right now?
- Immediate resistance sits at $4,143.43 (R1), followed by $4,152.27 (R2). A break above these levels would target the 1-hour chart's upside arrow at $4,171.
- Is gold still in a downtrend?
- Yes, technically. Price at $4,146.20 remains below the MA50 at $4,144.81, confirming the bearish structure. A close above $4,152.27 would be needed to shift the near-term bias.
- What events could move gold price this week?
- US Retail Sales and PPI data today, followed by Fed Chair Kevin Warsh's fireside chat on Friday. Hawkish comments from Warsh could pressure gold back toward $4,125.28, while dovish signals could push price toward $4,152.27.
- What is the expected trading range for gold today?
- With an ATR of $12.37, the expected hourly range is approximately 0.30%. The Bollinger Bands span from $4,117.11 to $4,167.88, framing the broader intraday range.
Risk Disclaimer: Trading Gold (XAU/USD) carries significant risk of loss and is not suitable for all investors. This content is for informational purposes only and does not constitute financial advice. Always conduct your own research and trade responsibly.